李寧市值首破千億!冷冬之際體育用品迎來“春天”
今日,港股市場主要指數漲跌不一,體育用品股全線走強,板塊大漲4.32%,李寧(02331)領漲6.54%,報40.75港元;安踏體育(02020.HK)大漲4.45%、中國動向(03818.HK)漲4%、滔博(06110.HK)、361度(01361.HK)以及特步國際(01368.HK)都有不同程度漲幅。
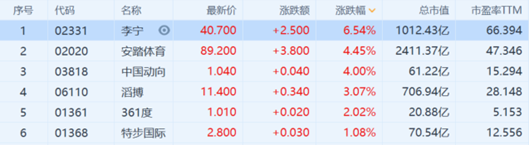
來源:富途
股價方面,李寧自今年二季度以來股價就一路高漲,自3月股價最低點至今,累計漲幅已達176%,今日更是創造了股價歷史新高,收盤價40.7元/股。
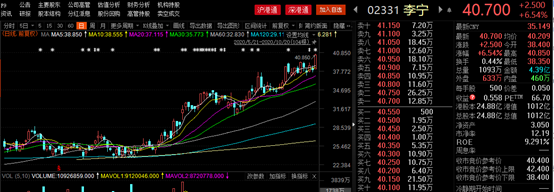
來源:choice
李寧是家喻户曉的“體操王子”,更是中國領先的體育品牌企業,產品包括運動鞋、服裝、體育器材等。
體育用品近年來一直維持着高增長態勢,行業十年複合12%的增長,2019年李寧淨利潤同比更是增長超100%。然而2020年,全球體育用品及服裝業都受到了疫情的嚴重打擊和影響。2020年上半年李寧營業收入同比下滑1%,權益持有人應占利潤同比下滑逾14%。但若扣除上年同期一次性與經營無關的損益,淨利潤上升21.7%。
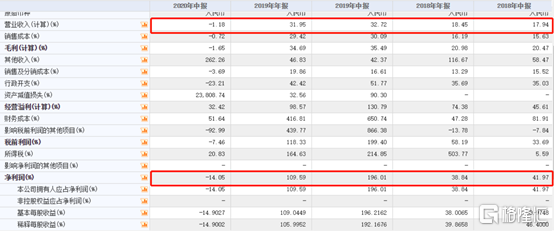
來源:choice
因李寧的直營店鋪大多在一二線城市,上半年人流的大幅下降使線下的銷售受到了比較大的衝擊。公司在今年上半年零售端和批發端都有10%-20%的下滑,門店也同比急劇減少,直接經營銷售收入下降約24%。
但李寧沒有隨着全球服裝業的業績萎靡而放棄,而是及時順應人們線上消費的新習慣,加強了電子商務渠道的線上銷售。當前電商在各渠道收入佔比已增至28%,電商渠道收入較去年同比增長23%。
10月20日,李寧發佈最新運營狀況,稱第三季度同店表現上,銷售按年取得低單位數增長,就渠道而言零售及批發均取得中單位數下降,而電子商務虛擬店鋪業務按年增長為30%-40%;零售表現上,電子商務虛擬店鋪業務取得40%-50%的增長。
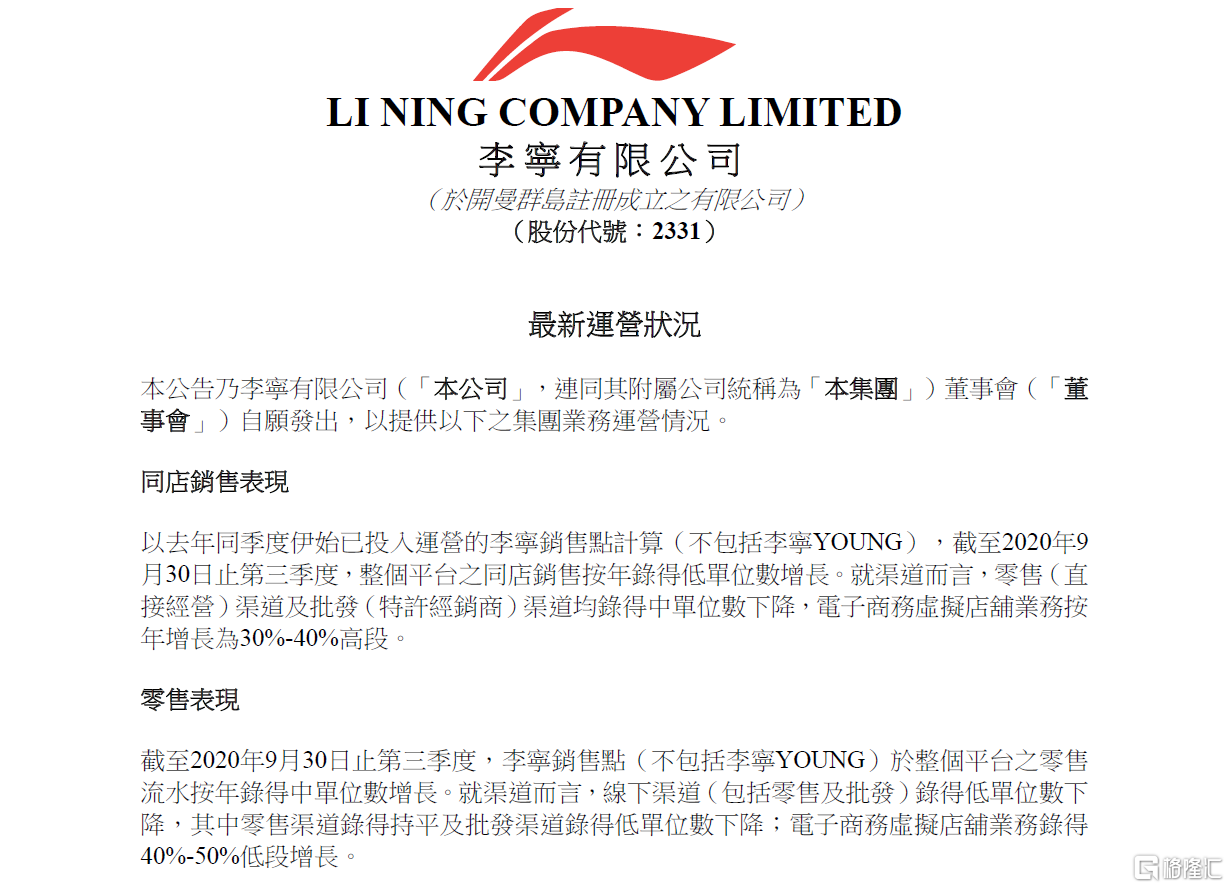 來源:公司公告
由此可見,李寧對於集團資源的重新整合以及線上電商銷售渠道的重視在第三季度已取得了不錯的成績,電子商務銷售渠道和收入都持續維持着高增長態勢,線上電商業務或將成為未來李寧銷售收入的重要來源之一。
早前有研報指出,國內體育市場與歐美成熟市場差距顯著,長期需求增量廣闊。體育服飾行業的發展空間仍然很大,遠未到天花板。隨着疫情影響的消減,人們對於體育用品的需求已慢慢回升,尤其是線上銷售渠道方面,第三季度更是漲勢迅猛。
數據顯示,2020年7-9月阿里全網運動服銷售同比增長分別為25.9%、32.1%、49.7%,銷量逐月大幅加速;2020年7-9月運動鞋銷售同比增長分別為18.6%、11.3%、31.3%,9月提速顯著。
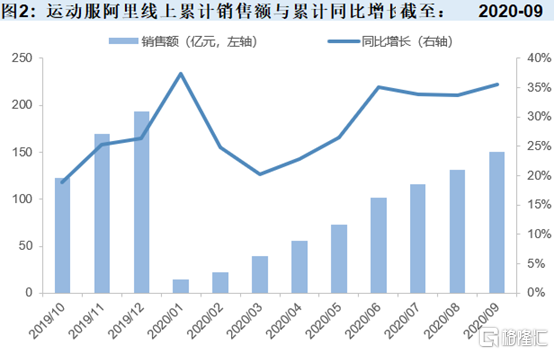
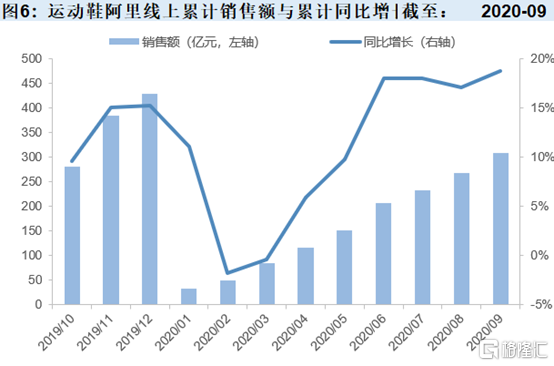
來源:國信證券
同時,後疫情時代,人們對於鍛鍊身體的意識也不斷增強,户外旅行、户外運動的比率也較上半年大幅增長,加上四季度雙十一電商旺季的馬上到來,這些都為四季度體育用品的強勁表現奠定了基礎。
另外,近期中共中央和國務院辦公廳印發了《關於全面加強和改進新時代學校體育工作的意見》及《關於全面加強和改進新時代學校美育工作的意見》提出,全面加強及改進體育和美育工作。政策對於體育方向的強調和重視,對於後期李寧等體育用品的業績恢復和提升也將有着很強的提振作用。
Follow us
Find us on
Facebook,
Twitter ,
Instagram, and
YouTube or frequent updates on all things investing.Have a financial topic you would like to discuss? Head over to the
uSMART Community to share your thoughts and insights about the market! Click the picture below to download and explore uSMART app!

Disclaimers
uSmart Securities Limited (“uSmart”) is based on its internal research and public third party information in preparation of this article. Although uSmart uses its best endeavours to ensure the content of this article is accurate, uSmart does not guarantee the accuracy, timeliness or completeness of the information of this article and is not responsible for any views/opinions/comments in this article. Opinions, forecasts and estimations reflect uSmart’s assessment as of the date of this article and are subject to change. uSmart has no obligation to notify you or anyone of any such changes. You must make independent analysis and judgment on any matters involved in this article. uSmart and any directors, officers, employees or agents of uSmart will not be liable for any loss or damage suffered by any person in reliance on any representation or omission in the content of this article. The content of the article is for reference only and does not constitute any offer, solicitation, recommendation, opinion or guarantee of any securities, virtual assets, financial products or instruments. Regulatory authorities may restrict the trading of virtual asset-related ETFs to only investors who meet specified requirements. Any calculations or images in the article are for illustrative purposes only.
Investment involves risks and the value and income from securities may rise or fall. Past performance is not indicative of future performance. Please carefully consider your personal risk tolerance, and consult independent professional advice if necessary.


