都是白馬股,別人閃崩它們沒事?19只千億市值個股節後股價創歷史新高
作者:費天元
來源:上海證券報
國慶假期之後,A股市場整體表現強勢。雖偶有大白馬遭遇閃崩,但還是有不少個股在短短的4個交易日內跑出顯著的超額收益,其中多家千億市值公司股價刷出歷史新高,反映大資金抱團現象並未改變。
Wind數據顯示,節後4個交易日中,已有19家千億市值公司股價創歷史新高,主要分佈在傳統消費、消費電子、光伏等行業。
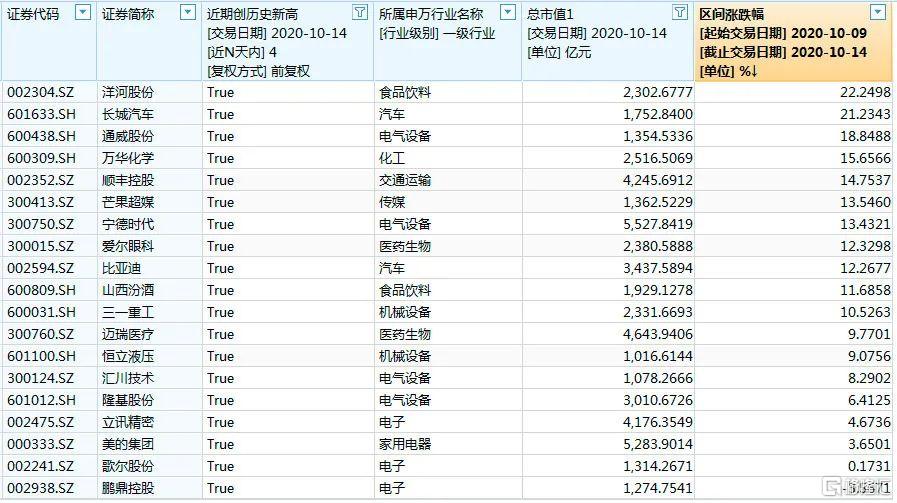
19家千億市值公司節後創新高
外資重倉股顯著發力
值得關注的是,上述19只節後股價創新高的千億市值股票,多為外資的傳統重倉股。其中,洋河股份、寧德時代、恆立液壓等的北向資金最新持股數量佔自由流通股比例均超過10%。
白酒板塊洋河股份本週一股價強勢漲停,週二進一步上漲8.97%並創出歷史新高。節後4個交易日內,洋河股份累計漲幅高達22.25%。Wind數據顯示,截至10月13日,深股通渠道持有洋河股份7692.82萬股,佔該股自由流通股本的14.95%。
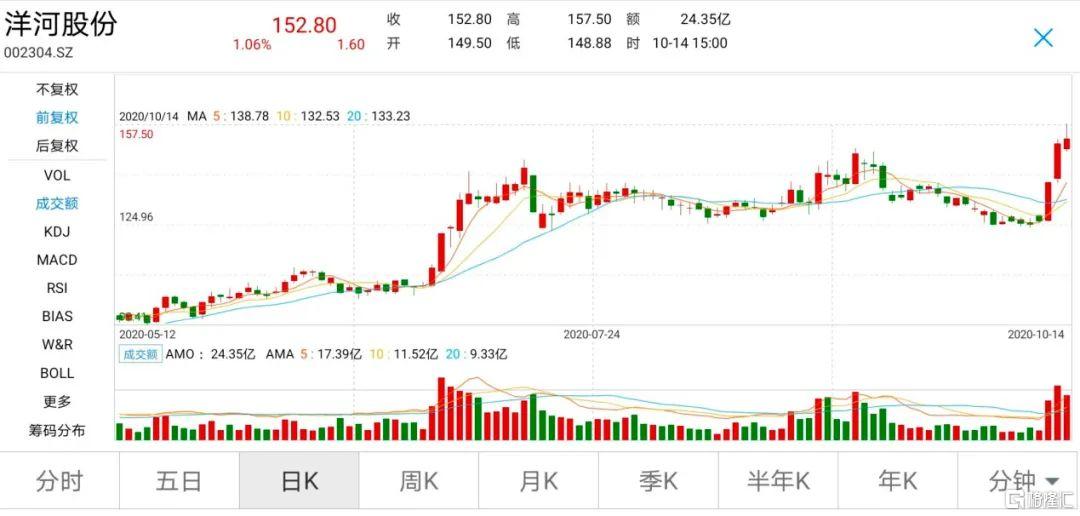
洋河股份日線走勢
“三年十倍”的恆立液壓延續屢創新高勢頭,節後股價收穫四連陽,累計上漲9.08%,並迭創歷史新高。
數據顯示,恆立液壓的滬股通持股數量節後繼續增長,從9月末的12861萬股增至10月13日的12984萬股,滬股通持股數量佔自由流通股本比例高達33.99%,顯示外資在該股已深度控盤。
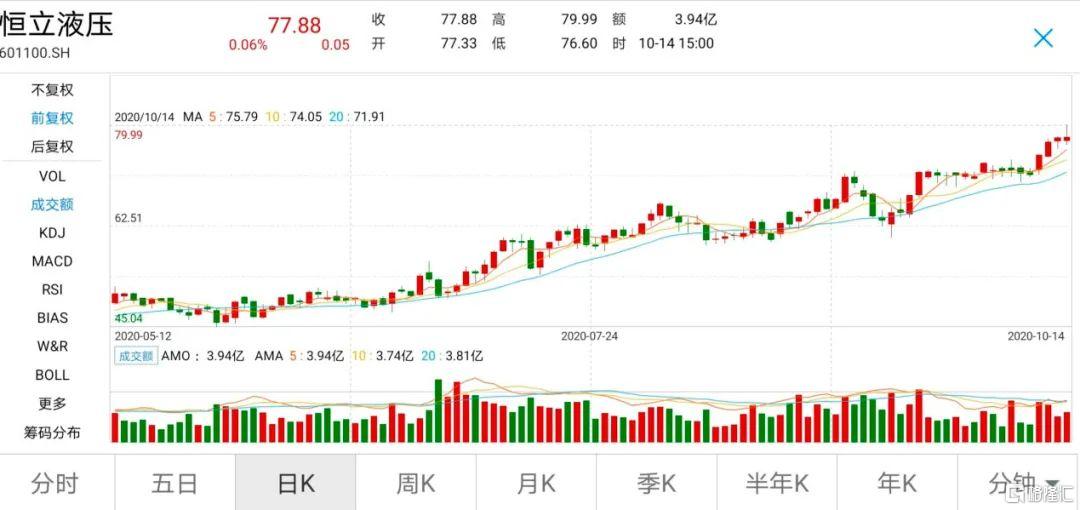
恆立液壓日線走勢
北向資金10月9日、10月12日兩天淨買入248億元,是帶動外資重倉股股價上揚的重要因素。機構分析認為,外資交易盤大幅迴流是造成北向資金趨勢逆轉的主要原因。隨着外部風險逐步落地,國內經濟復甦與盈利修復向縱深發展,四季度外資有望增量配置A股。
機構抱團態勢未變
除外資因素,境內機構持續抱團也是推動白馬股屢創新高的重要原因。
交易所公佈的龍虎榜顯示,洋河股份10月12日漲停當天,有3家機構席位分列買二至買四位置,合計買入額達2.87億元,佔個股當天成交總額的13.44%。
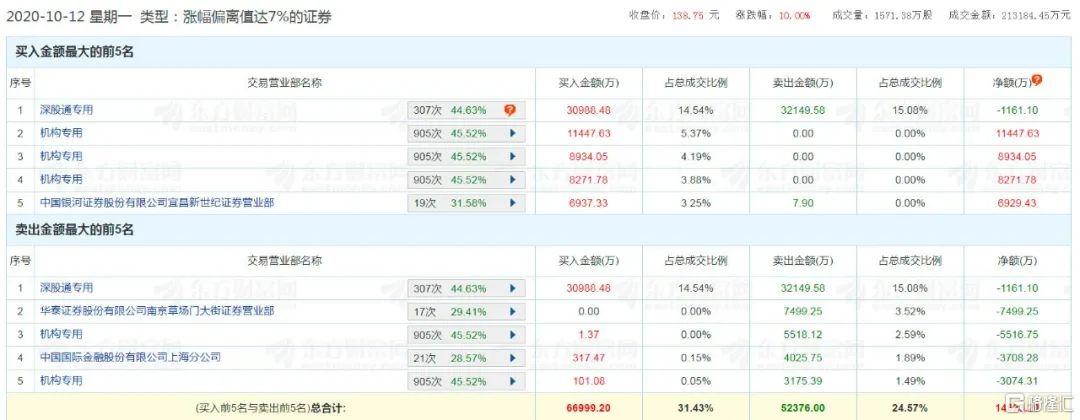
洋河股份10月12日龍虎榜
PCB龍頭鵬鼎控股節後股價同樣刷新歷史新高,該股10月12日龍虎榜中,除高居買一的深股通渠道淨買入2047萬元外,位列買二至買五的全部為機構席位。4家機構席位合計買入1.05億元,佔個股當天成交總額的8%。
鵬鼎控股10月12日龍虎榜
三季報業績成重要抓手
隨着三季報密集披露期臨近,業績確定性再度成為大資金考量的重點。在上述節後刷出歷史新高的千億市值公司中,不乏已披露三季報預告且業績亮眼的品種。
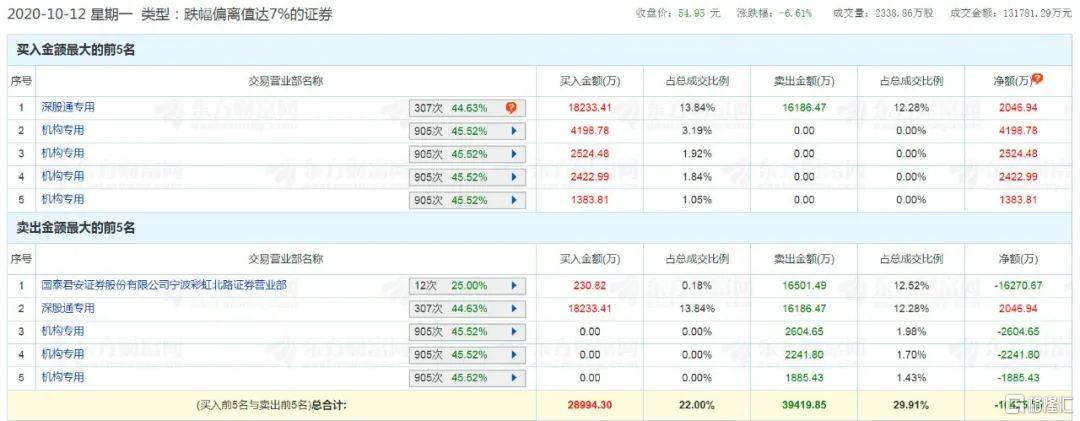
比亞迪10月12日晚間上修業績預告,前三季度淨利潤由原來的預增77.86%至90.56%,修正為預增115.97%至128.67%,即前三季度淨利潤由28億元至30億元,修正為34億元至36億元。
安信證券研報認為,比亞迪此次上修的三季報業績超出市場預期,主要原因在於新車型漢上市後持續熱銷,貢獻了較好的業績增量。另外,公司手機部件及組裝業務在主要客户的份額持續提升,玻璃陶瓷及新型智能產品出貨量增長迅速。
對應到盤面上,比亞迪節後股價跳空高開並連續4日上漲,累計漲幅達12.27%。公司目前市值升至3438億元,創歷史新高。
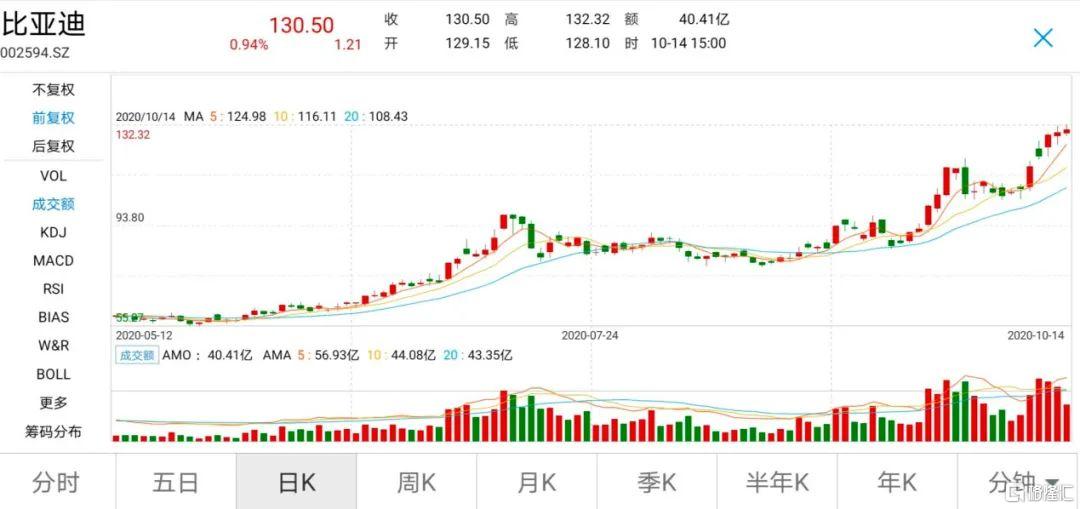
比亞迪日線走勢
同樣,邁瑞醫療三季報業績預增35%至45%,立訊精密三季報業績預增42%至61%,歌爾股份三季報業績預增71%至90%,上述3家千億市值公司節後股價同樣刷新歷史新高。
Follow us
Find us on
Facebook,
Twitter ,
Instagram, and
YouTube or frequent updates on all things investing.Have a financial topic you would like to discuss? Head over to the
uSMART Community to share your thoughts and insights about the market! Click the picture below to download and explore uSMART app!

Disclaimers
uSmart Securities Limited (“uSmart”) is based on its internal research and public third party information in preparation of this article. Although uSmart uses its best endeavours to ensure the content of this article is accurate, uSmart does not guarantee the accuracy, timeliness or completeness of the information of this article and is not responsible for any views/opinions/comments in this article. Opinions, forecasts and estimations reflect uSmart’s assessment as of the date of this article and are subject to change. uSmart has no obligation to notify you or anyone of any such changes. You must make independent analysis and judgment on any matters involved in this article. uSmart and any directors, officers, employees or agents of uSmart will not be liable for any loss or damage suffered by any person in reliance on any representation or omission in the content of this article. The content of the article is for reference only and does not constitute any offer, solicitation, recommendation, opinion or guarantee of any securities, virtual assets, financial products or instruments. Regulatory authorities may restrict the trading of virtual asset-related ETFs to only investors who meet specified requirements. Any calculations or images in the article are for illustrative purposes only.
Investment involves risks and the value and income from securities may rise or fall. Past performance is not indicative of future performance. Please carefully consider your personal risk tolerance, and consult independent professional advice if necessary.


