


作者:木青
來源:啟陽路4號
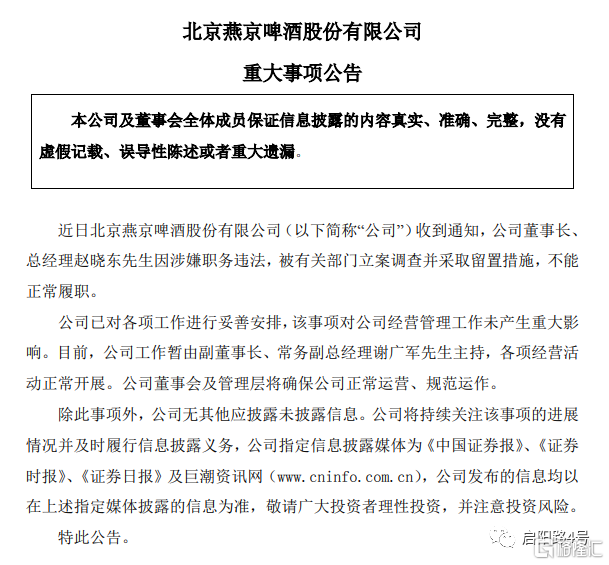
10月8日晚間,北京燕京啤酒股份有限公司(以下簡稱“燕京啤酒”)發佈公告稱,公司董事長、總經理趙曉東因涉嫌職務違法,被有關部門立案調查並採取留置措施,不能正常履職,公司工作暫由副董事長謝廣軍主持。
而今年9月16日,趙曉東剛剛連任燕京啤酒董事長之職。消息一出,業內譁然。事件公佈的第二天(10月9日)股票收盤時,燕京啤酒每股價格為8.26元,下跌2.02%;截至2020年10月12日收盤,燕京啤酒每股價格已跌至7.99元。
燕京啤酒披露,從2017年6月開始,趙曉東陸續接任公司董事長、總經理職位。當時,有媒體稱,燕京啤酒已進入趙曉東時代。但被寄予厚望的趙曉東卻未能扭轉燕京啤酒的業績下滑。
從財報可以看出,趙曉東接任後的3年,營業收入與淨利潤變化微弱。2017-2019年,燕京啤酒營業收入分別是111.96億元、113.44億元、114.68億元;而2015-2011年間,公司的營業收入始終保持在120億元以上。
此外,燕京啤酒在2017-2019年得淨利潤分別是1.73億元、2.24億元、2.63億元,均落後於2016年淨利潤。
01
昔日榮耀成往事
8月,燕京啤酒發佈了2020年上半年成績單。
整體而言,燕京啤酒業績表現差強人意,多項科目同比大幅下滑。半年報顯示,報告期內,公司營業收入為55.65億元,同比下滑13.88%;歸屬於上市公司股東的淨利潤2.69億元,同比下滑47.46%;基本每股收益0.0955元,同比下滑47.47%。對此,燕京啤酒在財報中解釋稱,公司的生產經營受疫情影響,面臨較大壓力。
在這樣得背景下,燕京啤酒旗下大部分產品營業收入均出現下滑。其中,主營啤酒的營業收入為51.78億元,同比下降13.63%;礦泉水的營業收入0.16億元,同比下降22.16%;茶飲料的營業收入0.29億元,同比下降24.94%。
而細梳燕京啤酒近二十年財報發現,2014年是公司業績的分水嶺。此前,公司的營業收入均正增長,呈現穩步上升趨勢;但從2014年開始,其營業收入進入下滑車道。
從2000-2013年,14年間燕京啤酒營業總收入從17.46億元一路攀升至137.48億元,一度躋身全球啤酒企業排行前十名。
但這樣的增長趨勢卻在2014年停滯不前。燕京啤酒披露,2014年,公司營業總收入為135.04億元, 同比下滑1.78%。顯然,這只是開始,從財報可以看出,2014-2019年,燕京啤酒的營業總收入逐漸下滑至114.68億元,減少近20億元。
與此同時,燕京啤酒的營業利潤從2015年開始下滑。
Wind顯示,2015年燕京啤酒實現營業利潤5.91億元,照比2014年的9.09億元下降34.96%。公司在財報中稱,受宏觀經濟、消費環境和天氣因素的影響,2015年啤酒行業產量負增長。
但隨後兩年,營業利潤仍在繼續下降。2016年,公司營業利潤減少至3.7億元,同比下降37%;2017年其實現營業利潤3.65億元,同比下滑1.35%。從財報數據可看出,2018年、2019年,營業利潤小幅度回暖,但依然未追上往日戰績。燕京啤酒披露,2018年、2019年,營業利潤分別是3.8億元、4.2億元,與2014年9.09億元的營業利潤差距懸殊。
02
十年未成一劍
不難發現,燕京啤酒一直試圖突破現狀。
燕京啤酒在財報中提及,公司通過一系列活動進軍年輕化市場,提升品牌影響力,進而重塑品牌。譬如,2019年7月,高端品類“燕京U8”問世;2020年5月,簽約藝人王一博為品牌代言人等。
廣告宣傳費用方面,燕京啤酒一直保持上億元投入。2017年-2019年以及2020年上半年,燕京啤酒的銷售費用分別是14.8億元、14.46億元、14.75億元、6.18億元。其中,2017年的廣告宣傳費4.33億元,佔當期銷售費用29.25%;2018年廣告宣傳費4.14億元,佔當期銷售費用28.63%;2019年廣告宣傳費為4.41億元佔當期銷售費用29.89%。
9月19日,趙曉東在“燕京啤酒文化節”開幕式上對外表示:“實現中國啤酒優質高階的品牌進階,燕京走了近十年。”
儘管如此,從上半年啤酒銷量來看,燕京啤酒的銷量並未因此得到跨越式突破。
2020年1-6月,燕京啤酒的啤酒銷量為209.69萬千升,照比2019年同期啤酒銷量的257.85萬千升下降18.68%。而同期,青島啤酒啤酒銷量僅同比減少6.85%;重慶啤酒啤酒銷量同比減少3.64%;珠江啤酒啤酒銷量同比下降7.83%。從以上數據可以看出,燕京啤酒下降速動明顯高於同業。
值得注意的是,燕京啤酒近年的盈利能力與運營能力均落後同業。
盈利能力方面,燕京啤酒在2017-2019年以及2020年上半年的銷售淨利率,分別是1.54%、1.98%、2.30%、5.74%;青島啤酒同期的銷售淨利率分別是5.26%、5.87%、6.89%、12.37%;重慶啤酒同期的銷售淨利率分別為10.27%、12.15%、20.34%、17.08%。
運營能力方面,燕京啤酒在2017年-2019年的存貨週轉率分別是1.85次、1.82次、1.79次,一直不斷下降。今年上半年在疫情等因素的加持下,存貨週轉率進一步下降,降至0.82次。
網上公開數據顯示,上半年,其他啤酒上市公司存貨週轉率分別是,青島啤酒3.32次、重慶啤酒2.71次、珠江啤酒2.01次、惠泉啤酒1.88次、華潤啤酒1.74次、蘭州黃河0.58次。顯然,燕京啤酒不僅在七家國產啤酒上市公司中排名第六,墊底同業,且低於業內平均存貨週轉率1.87次,超過了1次。
03
26個行政處罰
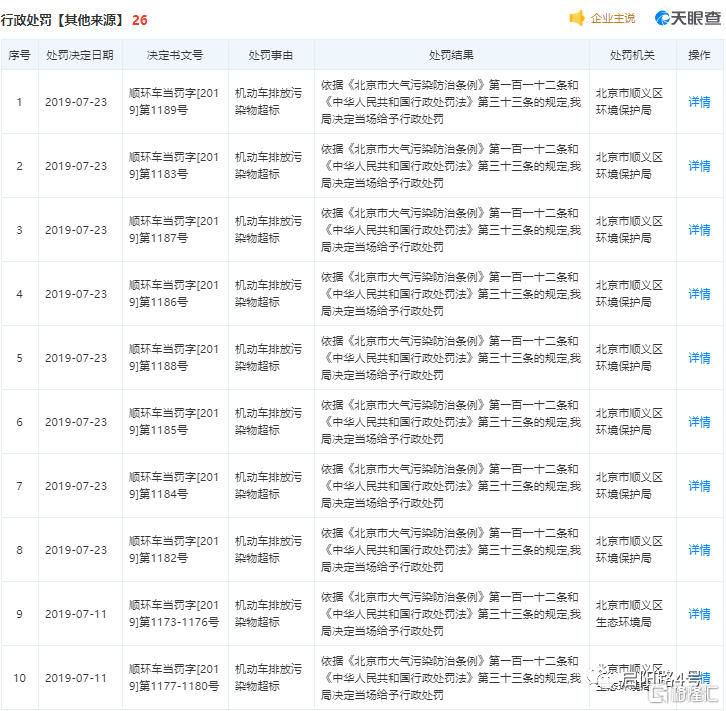
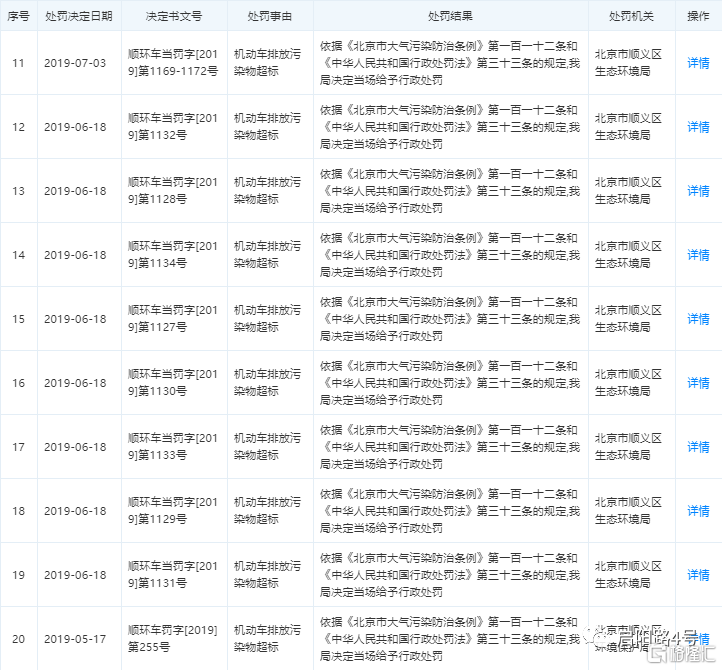
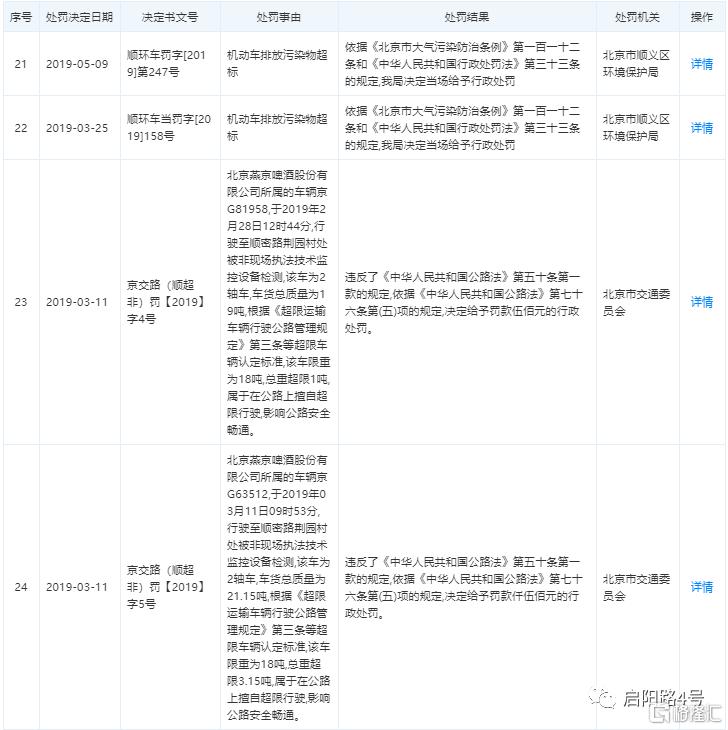
燕京啤酒在2019年收到多個行政處罰。
天眼查顯示,2019年1月-7月,燕京啤酒收到26個行政處罰。其中,有23個是由北京市順義區生態環境局發佈的處罰,處罰事由為機動車排放污染物超標。
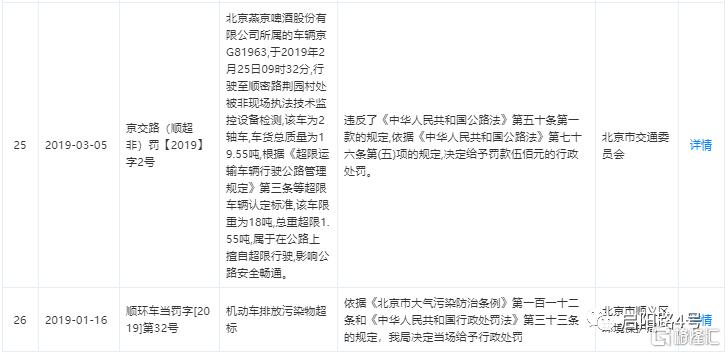
另外,據公開資料顯示,北京燕京啤酒股份有限公司一分公司在2019年12月25日,收到北京市生態環境局,京環境監察罰字[2019]155號的行政處罰決定書。
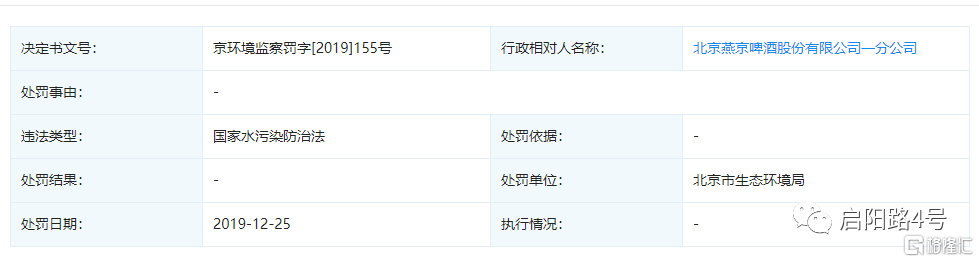
而燕京啤酒也在半年報中提及,隨着國家環保標準的提高,公司仍然面臨一定的環保風險。


More Content


