規模達年內高點!三季度槓桿資金持續流入,這些個股受偏愛
來源:東方財富網
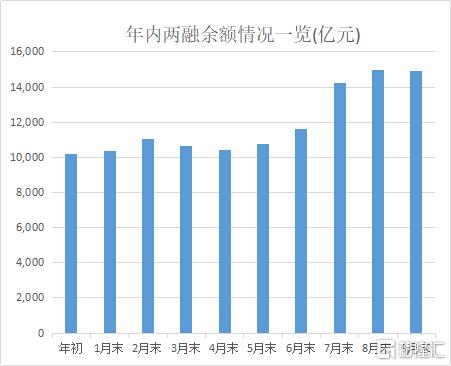
三季度大盤表現前高後低,滬指7月13日達到年內最高3458點,而與行情密切相關的兩融數據,則在9月3日達到15097億元高點,隨後稍有回落,至9月末為14904億元,但比6月末增加了2415億元。整個三季度更有20個股融資餘額增長了200%以上。
01
Q3兩融餘額達年內高點
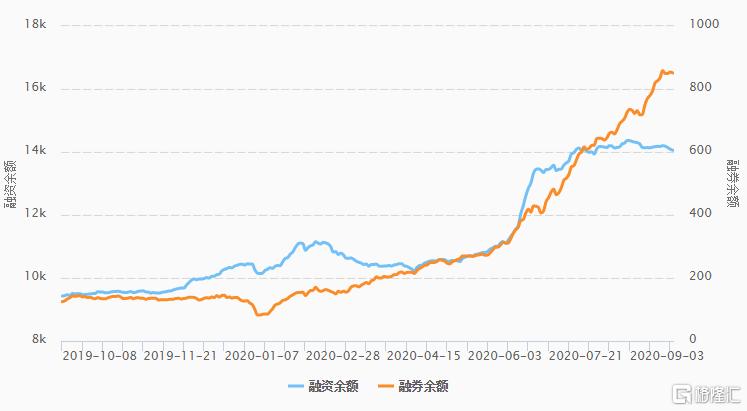
年初以來,兩融餘額持續增長。東方財富Choice數據顯示,截三季度末,兩融餘額達到14904億元,其中融資餘額為14053億元,融券餘額為851億元。與二季度末的兩融餘額11638億元相比,增加了2415億元。
(數據來源:東方財富Choice數據)
總體來看,三季度兩融餘額數據為年內峯值。東方財富Choice數據顯示,年內兩融餘額高點出現在9月上旬,9月3日兩融餘額達到年內高點,為15097億元,此後震盪下行。市場層面來看,上證指數在7月初至9月初正處“牛市行情”,市場兩融餘額也在期間一路向上,而9月初之後上證指數出現震盪回落,兩融餘額隨後也有小幅下滑。
02
槓桿資金偏愛金融板塊
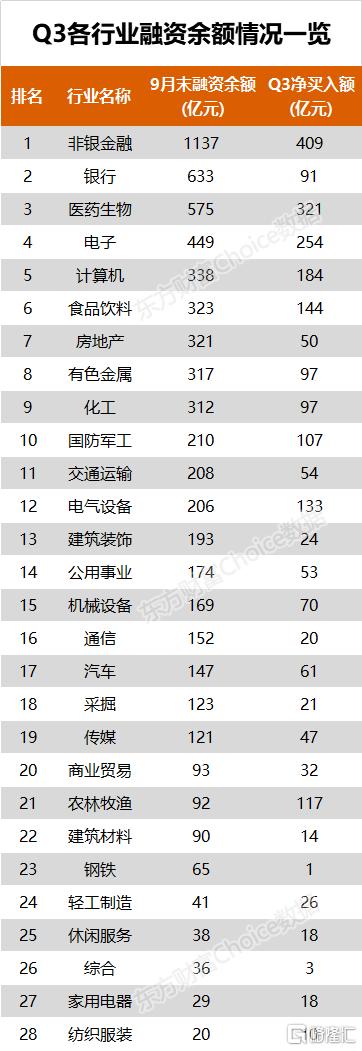
分行業看,融資規模最大的是非銀金融、銀行、醫藥生物。東方財富Choice數據顯示,截至三季度結束,這三個行業的融資餘額分別為1049億元、571億元、521億元。此外,電子、計算機、房地產、有色金屬四個行業的融資規模也均超300億元。相反融券的規模整體較低,除金融板塊外,其他行業的融券餘額均未超過60億元。
而三季度槓桿資金淨流入最大的行業則分別為非銀金融、醫藥生物、電子,融資淨買入金額分別為409億元、321億元、254億元。此外,三季度融資淨流入金額超100億元的行業還有計算機、食品飲料、電氣設備、農林牧漁、國防軍工。而鋼鐵、紡織服裝等行業,三季度槓桿資金流入不足10億元。
03
20股Q3融資餘額增超200%
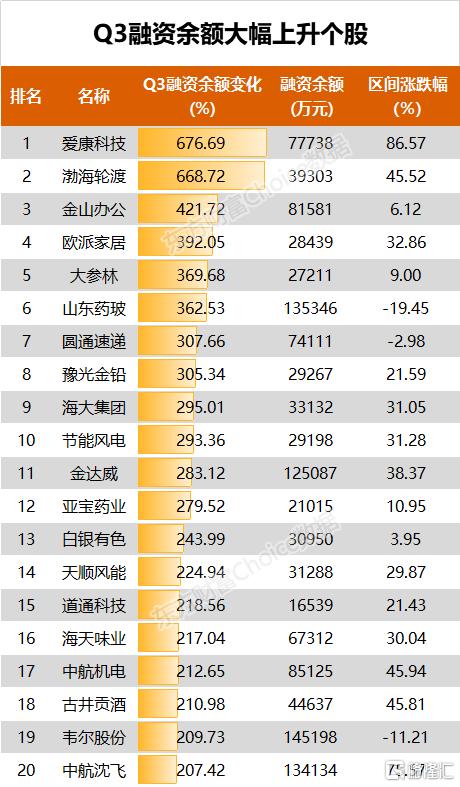
個券方面,三季度融資餘額出現增長的標的股有1316只,佔比32%,其中20只股融資餘額增幅超過200%。其中,融資餘額增幅最大的是愛康科技,其三季度末融資餘額為77738萬元,較二季度末增長677 %。另外,融資餘額增幅較大的還有渤海輪渡、金山辦公,其三季度融資餘額變化分別達669%和422%。
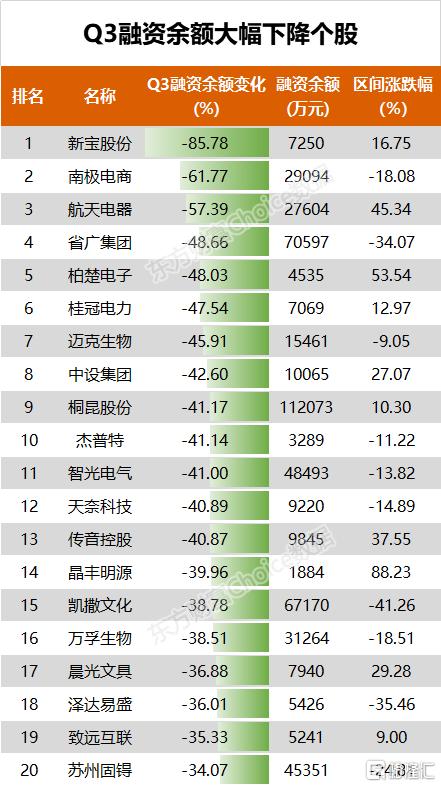
與之形成對比的是,三季度有366股融資餘額出現下降。其中,融資餘額降幅超過30%的有25只。其中,星宇股份的融資餘額降幅最大,三季度末融資餘額7250 萬元,與二季度末相比,融資餘額下降了85.78 %。此外,南極電商、航天電器的三季度融資餘額下滑幅度也較大,分別為62%和57%。
Follow us
Find us on
Facebook,
Twitter ,
Instagram, and
YouTube or frequent updates on all things investing.Have a financial topic you would like to discuss? Head over to the
uSMART Community to share your thoughts and insights about the market! Click the picture below to download and explore uSMART app!

Disclaimers
uSmart Securities Limited (“uSmart”) is based on its internal research and public third party information in preparation of this article. Although uSmart uses its best endeavours to ensure the content of this article is accurate, uSmart does not guarantee the accuracy, timeliness or completeness of the information of this article and is not responsible for any views/opinions/comments in this article. Opinions, forecasts and estimations reflect uSmart’s assessment as of the date of this article and are subject to change. uSmart has no obligation to notify you or anyone of any such changes. You must make independent analysis and judgment on any matters involved in this article. uSmart and any directors, officers, employees or agents of uSmart will not be liable for any loss or damage suffered by any person in reliance on any representation or omission in the content of this article. The content of the article is for reference only and does not constitute any offer, solicitation, recommendation, opinion or guarantee of any securities, virtual assets, financial products or instruments. Regulatory authorities may restrict the trading of virtual asset-related ETFs to only investors who meet specified requirements. Any calculations or images in the article are for illustrative purposes only.
Investment involves risks and the value and income from securities may rise or fall. Past performance is not indicative of future performance. Please carefully consider your personal risk tolerance, and consult independent professional advice if necessary.


