出口限制對中芯國際的影響分析
來源:半導體行業觀察綜合
近期中芯國際遭受美國出口限制的消息收到業界廣泛關注,隨後中芯國際也發表公告稱,“本公司和美國工業與安全局(Bureau of Industry and Security)已經展開了初步交流,我們將繼續積極與美國相關政府部門交流溝通。”
客户方面,中芯國際最大的客户是華為(佔據銷售額的18.7%),其次是高通(8.6%)、博通(7.5%)、安森美(3.5%)、Cobo(2%)、賽普拉斯(1.2%)。
據TrendForce旗下半導體研究處的觀點,中國半導體產業恐將面臨衝擊,中芯國際除了設備面臨限制之外,恐遭中國大陸以外的客户搶單,根據調研,高通、博通這兩大客户的投片產品都以8英寸廠0.18µm製程生產的PMIC為主,目前已陸續向中國台灣廠提出增加投片量的要求,但因現有晶圓代工8英寸產能普遍已滿載,若此時要求加單,恐怕導致供不應求的市況將更加嚴峻,漲價態勢恐持續至2021年。
此外,兆易創新供應Apple Airpods所使用的NOR Flash也在中芯國際以65/55nm製程製造,恐怕也將轉單至中國台灣廠華邦電、旺宏。
中芯國際購買設備的三大主要供應商是ASML、Lam Research和KLA,估計其佔中芯國際資本支出的11%、6.6%和3.5%。
值得注意的是,如圖1所示,中芯國際在2019年以45%的產能佔據了中國12英寸芯片企業的主導地位,中芯國際的負面消息將對半導體設備公司產生非常大的影響。相較之下,矽晶圓及半導體化學原物料主要由日系及歐洲供應商為主,初步判斷衝擊較小。
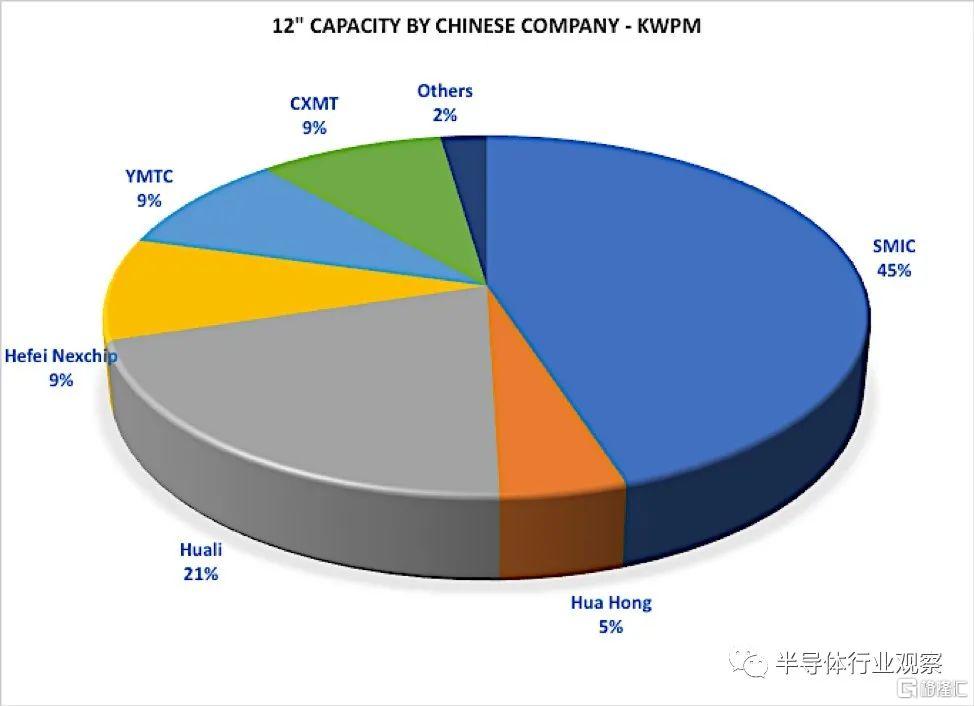
圖1
如下表所示,中芯國際計劃在2020年增加資本支出258.3%。
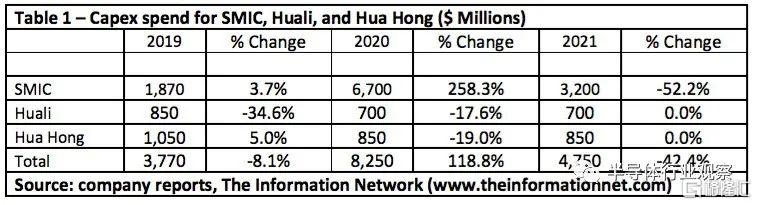
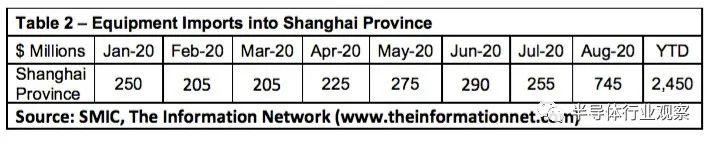
中芯國際在上海有一家12英寸廠,到2020年,上海市半導體進口總額達到24.5億美元。除了中芯國際,上海擁有300mm晶圓製造能力的還有華力和華虹宏力。所以,並非所有設備都是中芯國際進口的。從表1可以看出,中芯國際的產能份額為45%,華力為21%,華虹宏力為5%。此外,中芯國際2020年的資本支出佔總投資額83億美元的81%。
因此,從下表可以看出,中芯國際進口了大部分的設備。
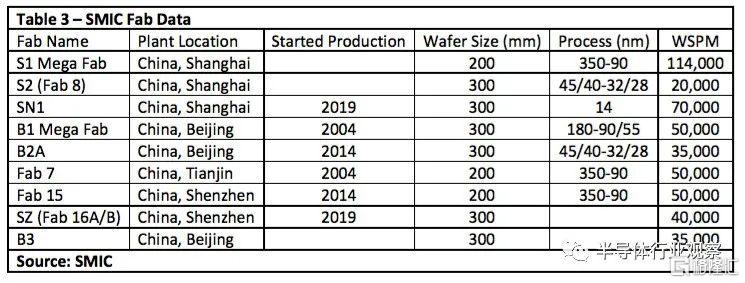
中芯國際以及上海相關的晶圓廠在設備方面囤貨,從下表看出,SN1廠的產能,滿載的情況下可以達到70000晶圓月產能(WSPM)。
根據TrendForce統計,目前晶圓代工市場仍以台廠以65%市佔居冠,其次則為韓國的16%及中國的6%。中芯國際在全球晶圓代工市佔率約為4%,全球排名第五,在中國地區則位列第一,也是中國目前唯一在14nm以下先進製程發展藍圖較為明確的晶圓製造商。數據稱,中芯國際2020年第一季度14nm業務的收入達到1200萬美元,儘管只佔收入的1.3%,但在持續增長中。
目前,中芯國際工藝能力已經能超越14nm,其N+1工藝已經進入客户產品認證階段。比14nm性能提升20%、功耗降低57%、邏輯面積縮小63%,SoC面積縮小55%。甚至與台積電的7nm工藝接近。
業內分析師稱,作為中國半導體制程領頭羊,面臨上游設備及原物料斷炊危機,將對其先進製程的發展以及中國半導體設備自制之路造成嚴重的衝擊。
最後,TrendForce強調,美國對中芯國際的斷供影響恐將大於福建晉華與華為,雖然近年來中國設備廠已迅速藉由與國內晶圓製造廠合作加緊練兵,但相較於晶片生產製程技術已逐步拉近與國際大廠的距離,中國設備廠的發展腳步仍落後國際大廠。
因此,中芯國際未來若少了國際設備的支援,先進製程的發展與演進將遭受阻礙,整個中國半導體產業的發展也將隨之受到衝擊。
Follow us
Find us on
Facebook,
Twitter ,
Instagram, and
YouTube or frequent updates on all things investing.Have a financial topic you would like to discuss? Head over to the
uSMART Community to share your thoughts and insights about the market! Click the picture below to download and explore uSMART app!

Disclaimers
uSmart Securities Limited (“uSmart”) is based on its internal research and public third party information in preparation of this article. Although uSmart uses its best endeavours to ensure the content of this article is accurate, uSmart does not guarantee the accuracy, timeliness or completeness of the information of this article and is not responsible for any views/opinions/comments in this article. Opinions, forecasts and estimations reflect uSmart’s assessment as of the date of this article and are subject to change. uSmart has no obligation to notify you or anyone of any such changes. You must make independent analysis and judgment on any matters involved in this article. uSmart and any directors, officers, employees or agents of uSmart will not be liable for any loss or damage suffered by any person in reliance on any representation or omission in the content of this article. The content of the article is for reference only and does not constitute any offer, solicitation, recommendation, opinion or guarantee of any securities, virtual assets, financial products or instruments. Regulatory authorities may restrict the trading of virtual asset-related ETFs to only investors who meet specified requirements. Any calculations or images in the article are for illustrative purposes only.
Investment involves risks and the value and income from securities may rise or fall. Past performance is not indicative of future performance. Please carefully consider your personal risk tolerance, and consult independent professional advice if necessary.


