8月股東户數透析:“逆向指標”顯示,這些公司被“主力操盤”
作者:齊永超
來源:證券市場紅週刊
9月上旬,兩市上市公司陸續披露了截至8月31日的最新股東户數。整體梳理髮現,其中多家股東户數顯著下降公司獲得機構、陸股通(北上資金)等主力追捧,股價表現也可圈可點。另有公司股東户數大增,主力高位出逃,導致“散户”站崗。
8月籌碼集中股領跑大市
超華科技、青鳥消防等多股獲機構追捧
據不完全統計顯示,兩市當前共有逾500家公司陸續披露了8月31日的最新股東户數。進一步來看,剔除今年上市的新股,共有236家公司股東户數相較於今年二季度末出現下降。其中,85家股東户數降幅超10%,如超華科技、青鳥消防、華陽國際、榮豐控股、安妮股份、錢江摩托等23只股降幅則超過20%。
一般而言,股東户數顯著下降顯示“主力資金”參與力道增強,更能實現拉動股價。統計顯示,三季度以來(7月1日~9月10日),股東户數出現下降的公司平均實現了10.80%的漲幅,跑贏同期上證、深證與創業板三者5.5%的平均漲幅。另外,股東户數降幅超過10%的公司平均漲幅為16.14%,降幅超過20%的公司則實現了達30.37%的平均漲幅。這顯示出,股東户數下降越明顯的公司,其股價表現整體越強勁。
通過梳理股東户數降幅居前,且股價領跑的公司來看,包括如超華科技、青鳥消防以及北新建材、科順股份等具有“主力行蹤”出現,在股東户數下降期間獲得了機構席位、陸股通等大筆增持。
部分公司獲得了機構席位“主買”,如超華科技、青鳥消防就獲得機構超10億元大額買入。查閲資料顯示,超華科技8月31日的最新股東户數為55998户,相較於今年二季度末85957户減少29959户,降幅34.85%。三季度以來(至9月10日,下同),公司股價上漲了65.20%,顯著領跑大市。在此期間,超華科技共5次登上龍虎榜單,共獲得機構買入達6.86億元。
類似的還有青鳥消防,公司8月31日披露股東户數為11558户,相較於今年二季度末26465户減少14907户,降幅達56.33%。三季度以來,公司股價上漲了77%,同樣顯著領跑大市。統計顯示,公司在此期間共3次登陸龍虎榜,機構席位共買入3.32億元。
除了機構席位的資金追捧,陸股通在一些公司股東户數下降、股價上漲中同樣扮演了重要角色,如北新建材、科順股份等。北新建材8月31日披露的股東户數為36901户,相較二季度末44498户減少7597户,降幅17.07%,公司三季度以來上漲了47.21%,在此期間,陸股通資金共買入了北新建材約6.2億元。此外,股東户數降幅較大,且股價走勢較強的科順股份,三季度以來同樣獲得陸股通資金買入過億元。(見表1)
表1 8月31日股東户數相較於二季度末降幅居前公司(部分)
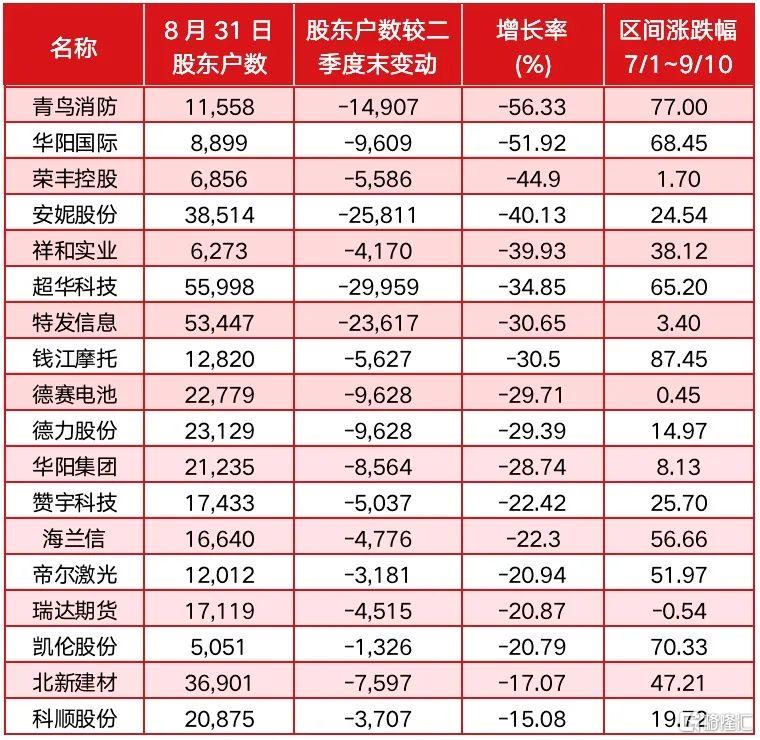
數據來源:Wind,紅週刊
警惕高位籌碼分散、“主力出逃”股
紅旗連鎖、凱撒文化等“有例在先”
值得一提的是,有公司股價相對高位出現股東户數增加、籌碼分散現象,大概率表明機構等主力“出逃”,值得警惕。數據研究顯示,股東户數顯著增加,機構高位派發籌碼,致一般投資人“高位站崗”不無先例,如紅旗連鎖、凱撒文化等。
不完全統計顯示,剔除今年上市的新股,兩市有約200家公司8月31日的股東户數相較於二季度末出現增加,其中,增幅在20%以上的有71家,增幅50%以上的有25家,如英特集團、紅旗連鎖、凱撒文化等。
紅旗連鎖最新披露的8月31日股東户數為63028户,相較於二季度末31537户增加31491户,增幅達1倍。公司股價自三季度以來下跌了25.92%。事實上,在公司股東户數增加期間主力資金卻在大筆賣出。Wind統計顯示,期間主力資金共賣出7.7億元,反而一些“小散資金”在買入。而公司股價也在這種“散户接盤”下自7月中旬出現高點以來持續下跌。
與紅旗連鎖“套路一致”的還有凱撒文化。凱撒文化8月31日股東户數為124251户,較二季度末78042户增加46209户,增幅59.21%。在公司股東户數增加期間,主力資金同樣在大筆賣出。Wind統計顯示,期間主力資金賣出金額達58億元。7月以來,凱撒文化分別在7月10日、20日、31日與8月10日、31日公佈了5次股東户數情況,其中7月10日的股東户數達到了136896户的最高位水平,而凱撒文化股價恰在當時達到了歷史最高點,公司股價至今已經“腰斬”。
表2 8月31日股東户數相較於二季度末增幅居前公司(部分)
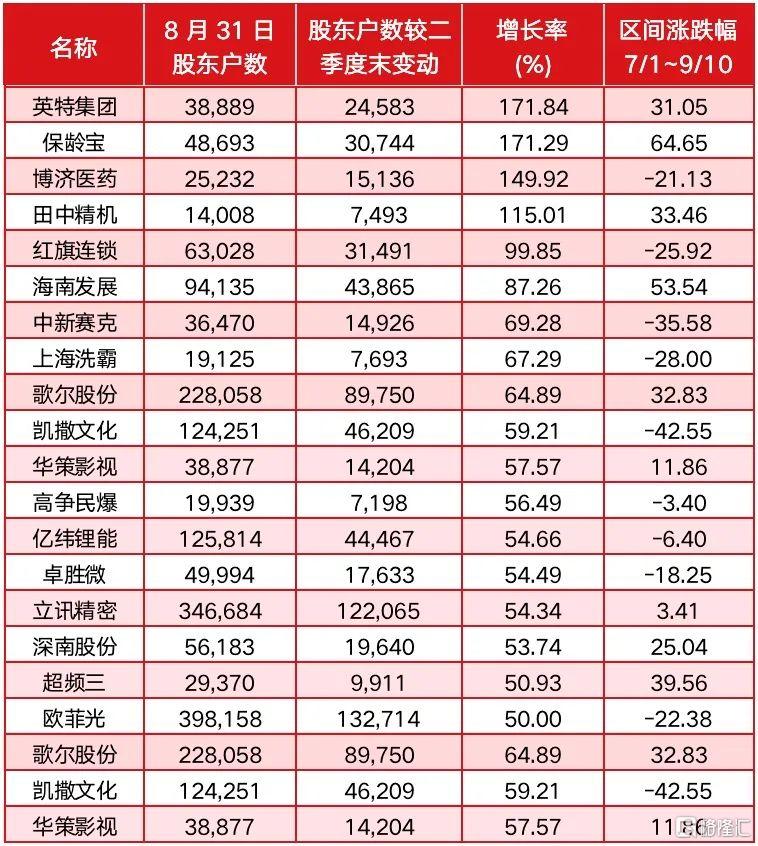
數據來源:Wind,紅週刊
Follow us
Find us on
Facebook,
Twitter ,
Instagram, and
YouTube or frequent updates on all things investing.Have a financial topic you would like to discuss? Head over to the
uSMART Community to share your thoughts and insights about the market! Click the picture below to download and explore uSMART app!

Disclaimers
uSmart Securities Limited (“uSmart”) is based on its internal research and public third party information in preparation of this article. Although uSmart uses its best endeavours to ensure the content of this article is accurate, uSmart does not guarantee the accuracy, timeliness or completeness of the information of this article and is not responsible for any views/opinions/comments in this article. Opinions, forecasts and estimations reflect uSmart’s assessment as of the date of this article and are subject to change. uSmart has no obligation to notify you or anyone of any such changes. You must make independent analysis and judgment on any matters involved in this article. uSmart and any directors, officers, employees or agents of uSmart will not be liable for any loss or damage suffered by any person in reliance on any representation or omission in the content of this article. The content of the article is for reference only and does not constitute any offer, solicitation, recommendation, opinion or guarantee of any securities, virtual assets, financial products or instruments. Regulatory authorities may restrict the trading of virtual asset-related ETFs to only investors who meet specified requirements. Any calculations or images in the article are for illustrative purposes only.
Investment involves risks and the value and income from securities may rise or fall. Past performance is not indicative of future performance. Please carefully consider your personal risk tolerance, and consult independent professional advice if necessary.


