You are browsing the Hong Kong website, Regulated by Hong Kong SFC (CE number: BJA907). Investment is risky and you must be cautious when entering the market.
科創板股票被嚴重低估?券商給出翻倍的目標價!
格隆匯 08-27 13:19

作者:費天元

來源: 上海證券報

今日早盤,A股市場延續寬幅震盪態勢。備受矚目的18只創業板註冊制新股多數回調。但創業板存量市場依然風生水起,截至上午收盤有8只創業板股票封上20%的漲停。

還有一個板塊的表現引發關注。科創板在連續調整近一個月後,早盤顯著復甦,漲勢甚至蓋過創業板。截至午間收盤,科創50指數收漲2.85%,漲幅跑贏上證綜指、深證成指與創業板指。
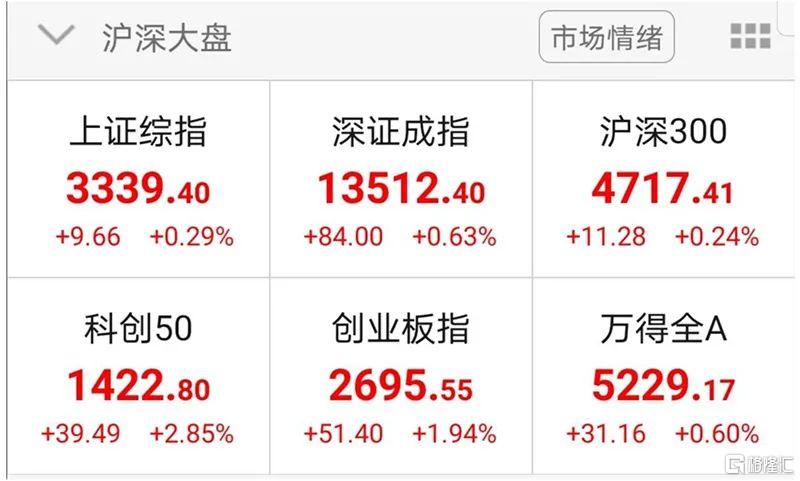
A股主要指數早盤表現

有市場人士認為,今年以來科創板資金情緒呈現週期性波動。前一階段科創板表現較其他板塊出現明顯折價,後續有望出現板塊性的情緒修復,值得持續觀察。

在此之前,科創50指數自8月3日大漲超過7%後,已連續調整近一個月,回撤幅度達到15%,同期上證指數僅微跌1.38%。
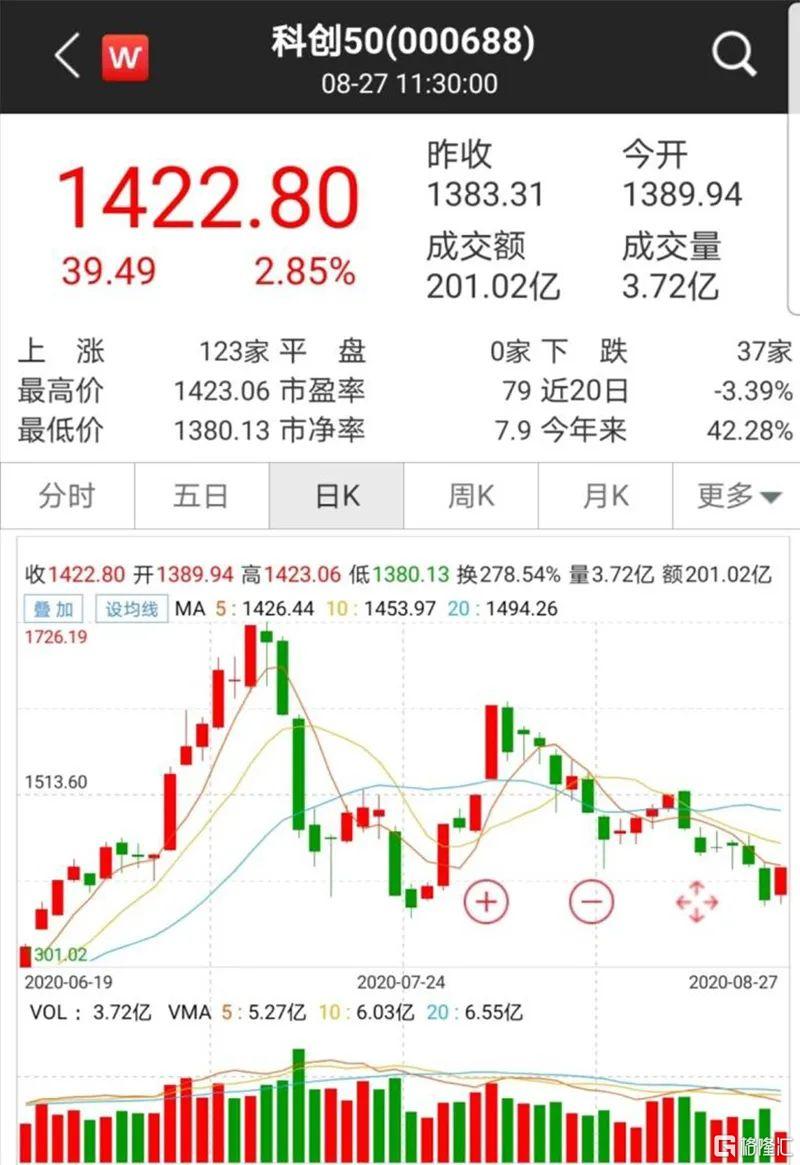
科創50指數日線走勢

部分在科創板情緒高位上市的新股回撤更為明顯。如8月6日上市的賽科希德,公司上市首日股價最高觸及186.00元/股,而公司昨日收盤價為91.99元/股,不到一個月已較高點回撤超過50%。
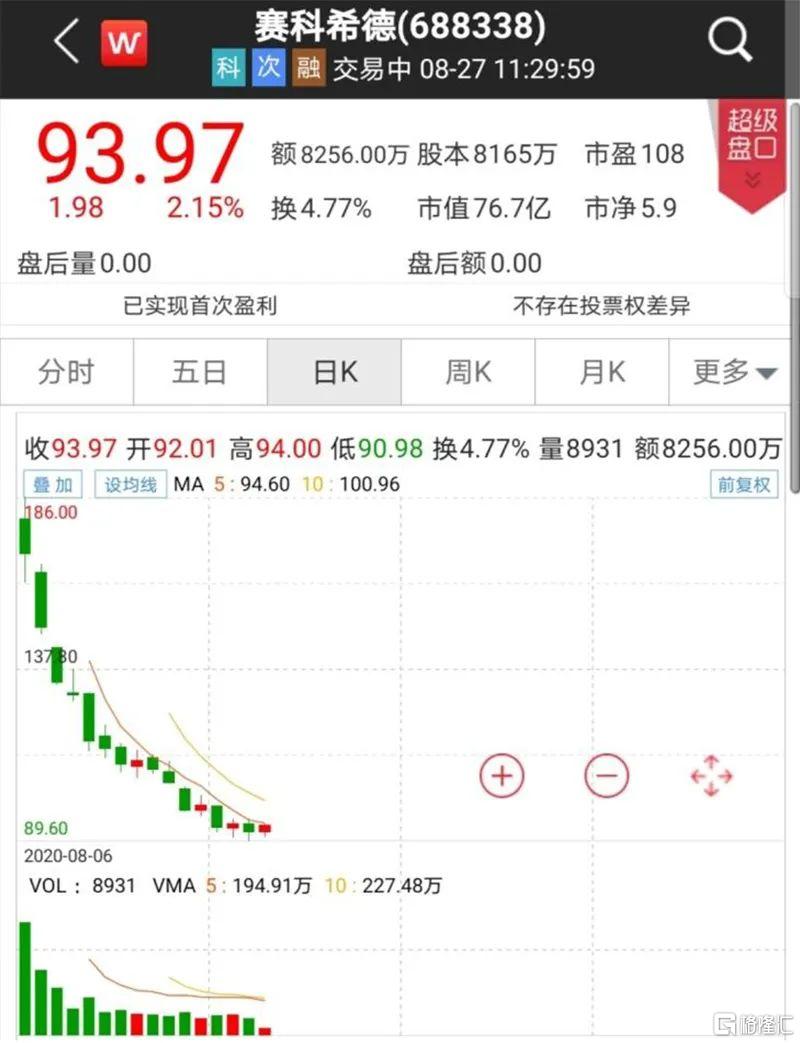
科創板新股賽科希德日線走勢

今日早盤科創板個股全線反彈,顯示資金情緒顯著升温。如何參與科創板這輪反彈,引發不少投資者討論。

值得一提的是,隨着科創板股票數量逐漸擴容,科創板投資機會集中於頭部公司的趨勢愈發明顯。而是否有券商分析師覆蓋,是研判科創板個股質地的重要指標。

興業證券策略團隊曾測算,有分析師覆蓋的科創板個股,往往被機構重倉持有,其收益率也顯著高於基準。並且,分析師覆蓋人數越多,股價漲幅就越大。

東財Choice數據顯示,近30天有券商分析師覆蓋並預測目標價的科創板股票,有18只昨日收盤價與券商目標價相比,潛在上漲空間超過50%,其中有兩隻股票潛在上漲空間超過100%。

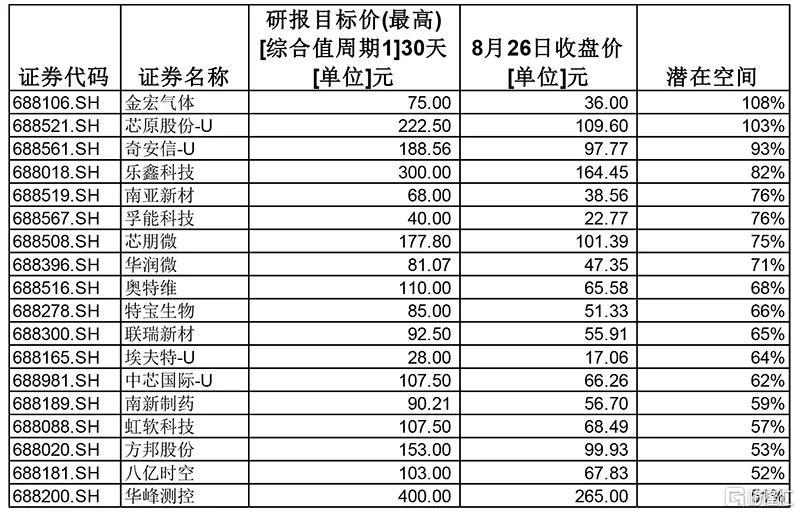
18只科創板股票昨日收盤價較券商目標價折價超過50%

金宏氣體昨日收盤報36.00元/股。中信建投電子團隊8月21日發佈研報,給予公司6個月目標價75元/股。潛在空間高達108%。

中信建投認為,2020年至2025年是中國大陸晶圓廠投產高峯期,新的晶圓廠擴產給國內廠商迎來替代機會。根據國內晶圓廠的建設速度和規劃,預計2025年國內電子氣體市場是2019年的兩倍,中國大陸電子氣體市場空間將會接近300億元大關。

中信建投表示,金宏氣體聚焦氣體制造和研發,國產化半導體趨勢受益機會確定。考慮到金宏氣體在電子氣體領域的核心競爭力,以及未來推出TGCM服務深度綁定客户,以2020年160倍PE給予6個月目標價75元/股。

芯原股份昨日收盤報109.60元/股。信達證券電子團隊8月21日發佈研報,給予公司2021年目標價222.5元/股,潛在上漲空間達103%。

信達證券認為,芯片定製業務賦予芯原股份在先進製程節點上的設計能力,短期有望依託服務器芯片定製化、汽車電子、安防芯片替換快速增長,長期未來有望搭乘Chiplet技術快速發展之東風,革新商業模式,打開市場空間。

信達證券表示,對比國內A股芯片設計公司估值,給予公司芯片定製業務2021年25倍的PS,對應市值為414億元。公司半導體IP授權業務及公司芯片定製業務兩項業務合計估值1074.6億元,整體PS估值對應2021年45.0倍,對應目標價約為222.5元/股。

當然,券商分析師給予的目標價與公司股價實際表現肯定會有偏差。

業內人士提醒投資者,券商研報給予評級或目標價,是分析師通過各種市場途徑收集基礎研究材料,例如公開信息、實地調研材料、統計數據等等,在此基礎上進行數據加工和處理、建立分析模型、提出各種假設條件,並通過分析模型最終得出分析結論。

在股票市場中,券商的研報目標價不一定準確。由於股票價格受到市場資金變化、上市公司發展變化、市場環境變化等因素影響,會導致股票價格的漲跌充滿不確定性。而券商研報只是對公司某個特定時間段的研究分析,因此不具有連續性和完整性。

Follow us
Find us on Facebook, Twitter , Instagram, and YouTube or frequent updates on all things investing.Have a financial topic you would like to discuss? Head over to the uSMART Community to share your thoughts and insights about the market! Click the picture below to download and explore uSMART app!
Disclaimers
uSmart Securities Limited (“uSmart”) is based on its internal research and public third party information in preparation of this article. Although uSmart uses its best endeavours to ensure the content of this article is accurate, uSmart does not guarantee the accuracy, timeliness or completeness of the information of this article and is not responsible for any views/opinions/comments in this article. Opinions, forecasts and estimations reflect uSmart’s assessment as of the date of this article and are subject to change. uSmart has no obligation to notify you or anyone of any such changes. You must make independent analysis and judgment on any matters involved in this article. uSmart and any directors, officers, employees or agents of uSmart will not be liable for any loss or damage suffered by any person in reliance on any representation or omission in the content of this article. The content of the article is for reference only and does not constitute any offer, solicitation, recommendation, opinion or guarantee of any securities, virtual assets, financial products or instruments. Regulatory authorities may restrict the trading of virtual asset-related ETFs to only investors who meet specified requirements. Any calculations or images in the article are for illustrative purposes only.
Investment involves risks and the value and income from securities may rise or fall. Past performance is not indicative of future performance. Please carefully consider your personal risk tolerance, and consult independent professional advice if necessary.
uSMART
Wealth Growth Made Easy
Open Account