銀行、券商批量漲停,2015年行情已經到來?
來源: Wind
7月6日,A股大幅上漲,北上資金連續3天單日淨流入超100億元,萬得全A總成交突破1.5億,50多隻金融股漲停,彷彿嗅到2015年那波牛市的味道。
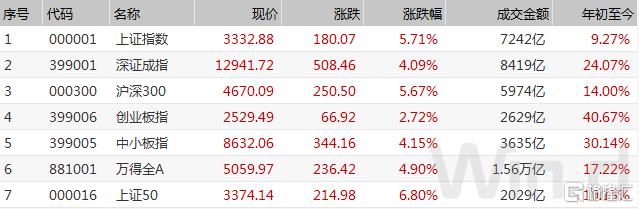
7月6日,滬深兩市大幅上漲,截至收盤,上證指數漲5.71%報收於3332.88點;深成指漲4.09%報收於12941.71點;創業板指漲2.72%報收於2529.49點,萬得全A總成交1.56萬億元。
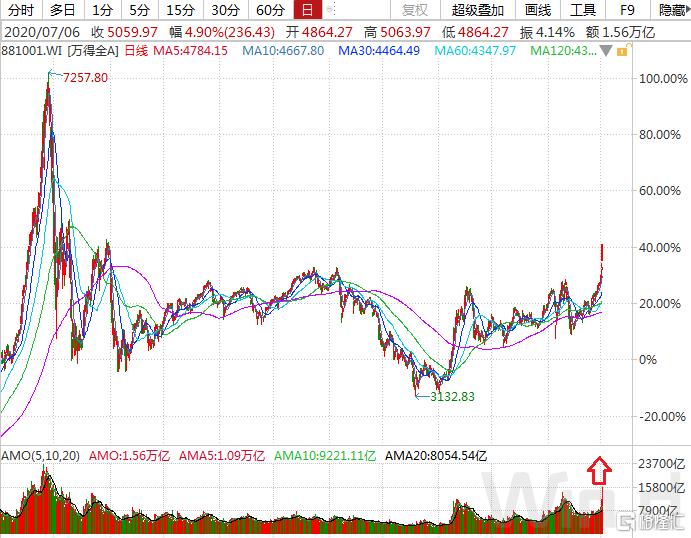
成交量創5年多新高
7月6日,A股放量拉昇,萬得全A總成交額達1.56萬億元,創5年多來新高,已逼近2015年巔峯時的成交量水平。與此同時,6月份以來,市場基本呈現出量價齊升的態勢,賺錢效應明顯。
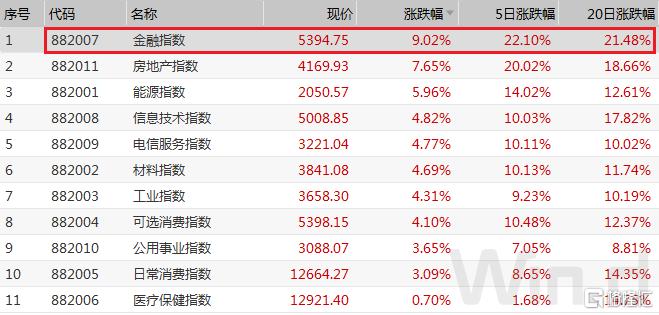
行業板塊普遍上漲
7月3日,除醫療保健板塊漲幅低於1%外,其餘行業板塊漲幅均超過3%,其中金融板塊漲幅達9.02%位居首位,且從5日漲幅來看,金融板塊同樣位居首位。此外,房地產板塊漲幅亦高達7.65%。近日市場呈現的一個明顯特徵,金融、房地產板塊連續大幅拉昇。
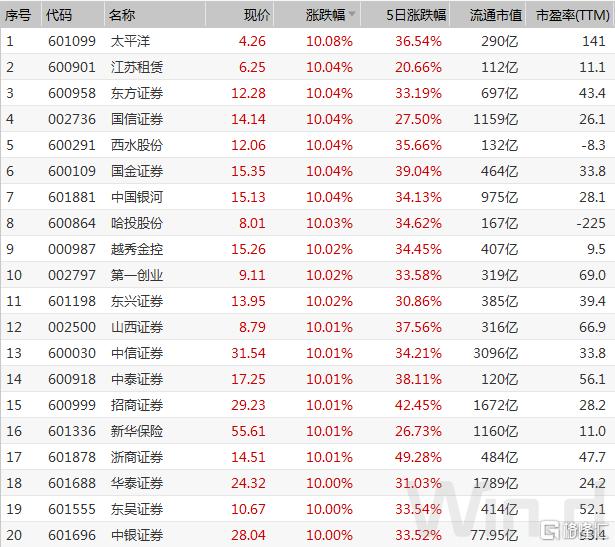
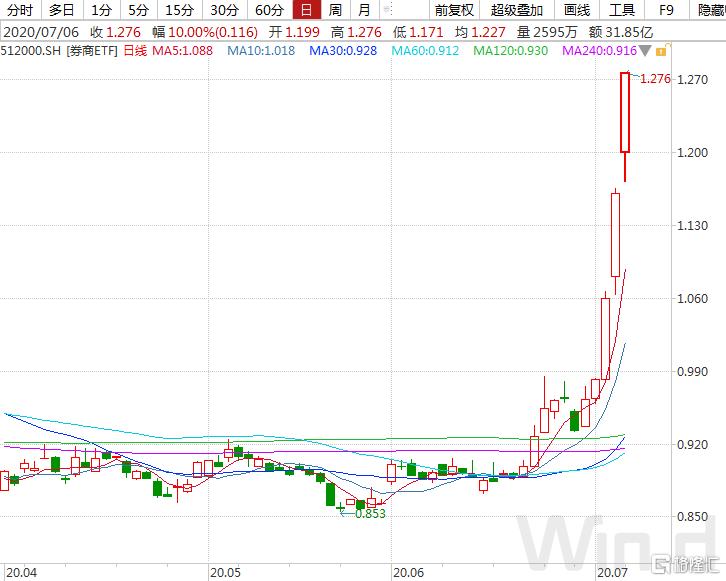
金融板塊中,券商股再迎漲停潮,截至7月6日收盤,券商ETF以漲停板報收。
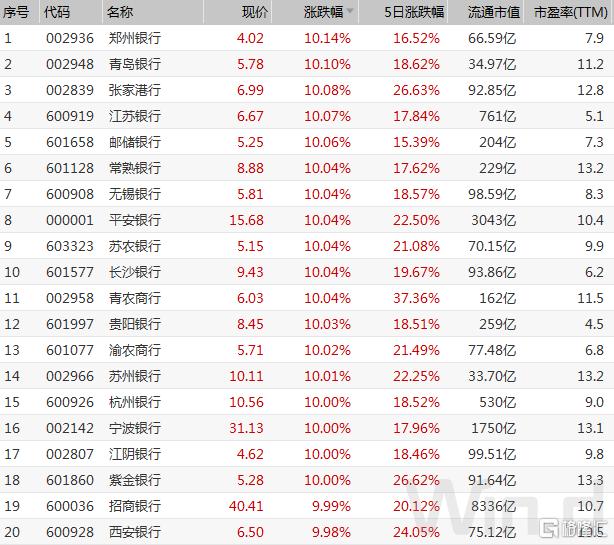
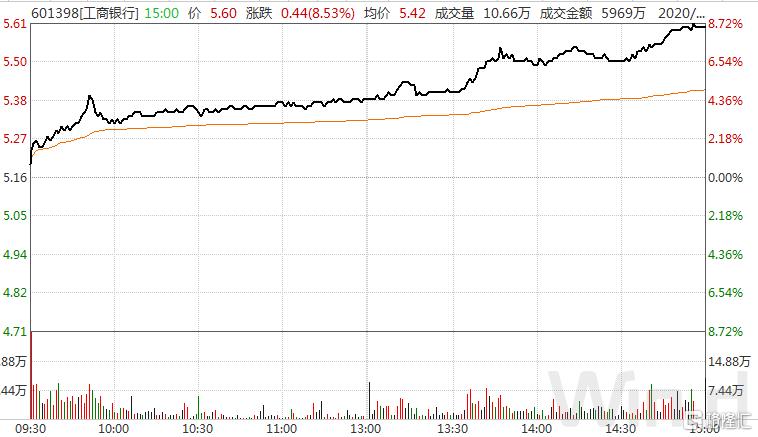
如果説券商已經十分罕見,那麼銀行股集體漲停則在A股歷史上屈指可數。7月6日,有20多家銀行股漲停,連工商銀行漲幅都達8.53%,創近5年來最大單日漲幅。
北上資金連續3日淨流入超百億
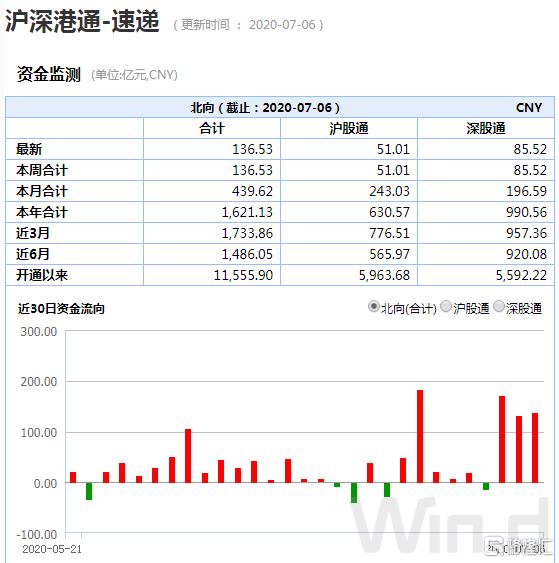
7月6日,北上資金淨流入136.53億元,連續3日淨流入突破百億。本月淨流入439.62億元,且今年以來,北上資金淨流入超過1600億元。可見,隨着中國對外開放的不斷深入,A股市場對外資的吸引力也越發強烈。
北上資金大舉掃貨金融
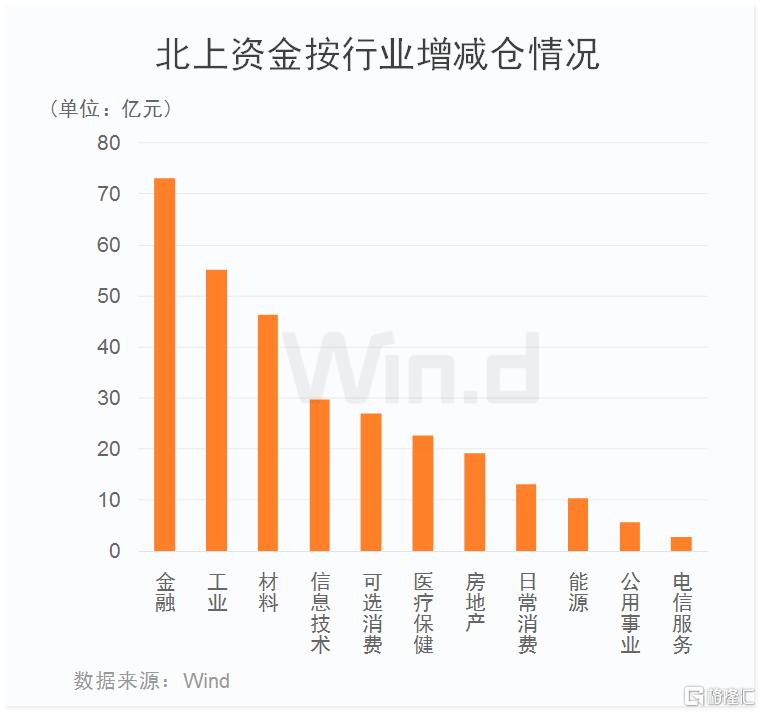
Wind統計顯示,從上週北上資金持股變動金額行業分佈來看,所有板塊全部淨買入,其中,金融板塊淨買入超過70億元,位居首位;此外,材料、工業、信息技術等板塊買入金額亦較多。
(北上資金6月30日持股與7月3日持股對比,變動市值 = 變動數量 X 7月3日收盤價,下同)
金融、消費大幅加倉
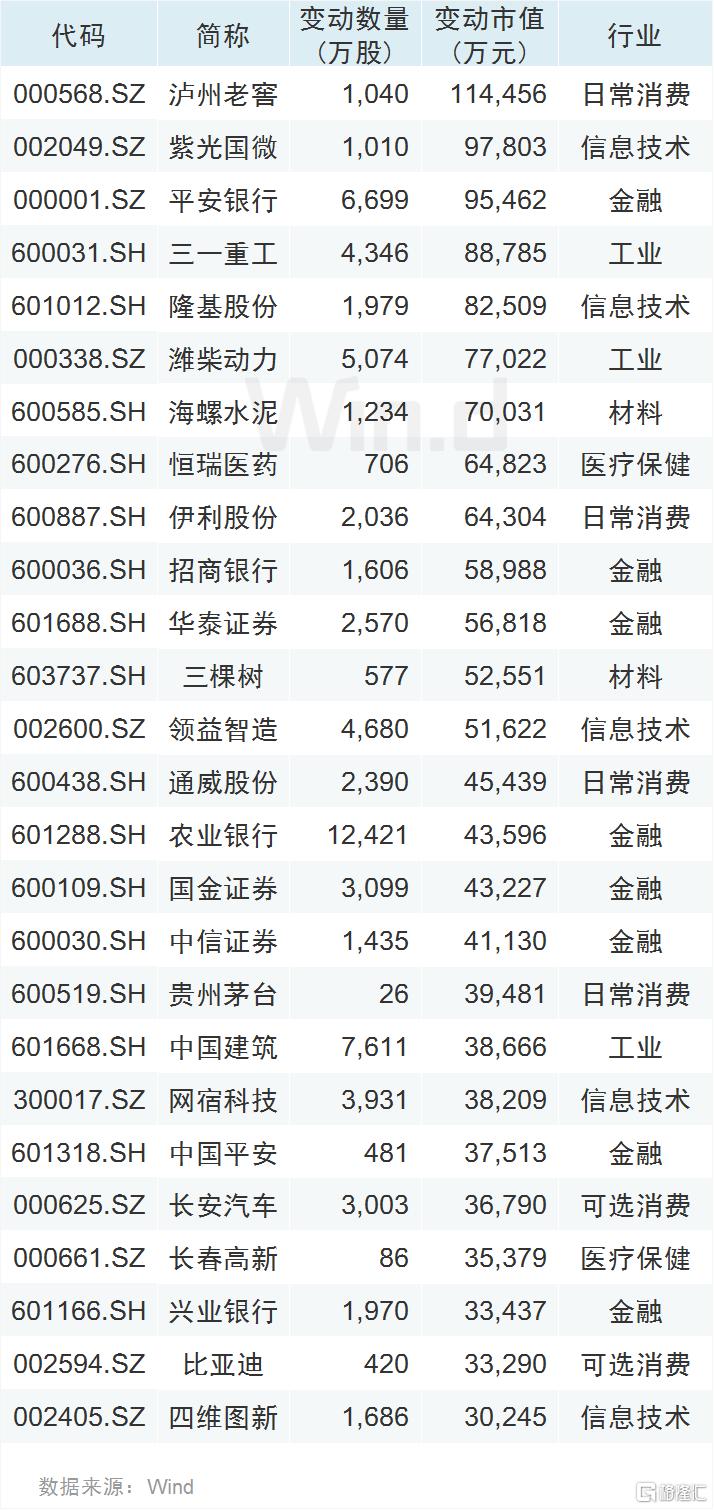
Wind統計顯示,從北上資金持股變動市值統計來看,有26家公司本月北上資金淨買入超3億元,其中,瀘州老窖淨買入額超11億元,位居首位;此外,紫光國微、平安銀行、三一重工、隆基股份、濰柴動力、海螺水泥淨買入均超7億元。
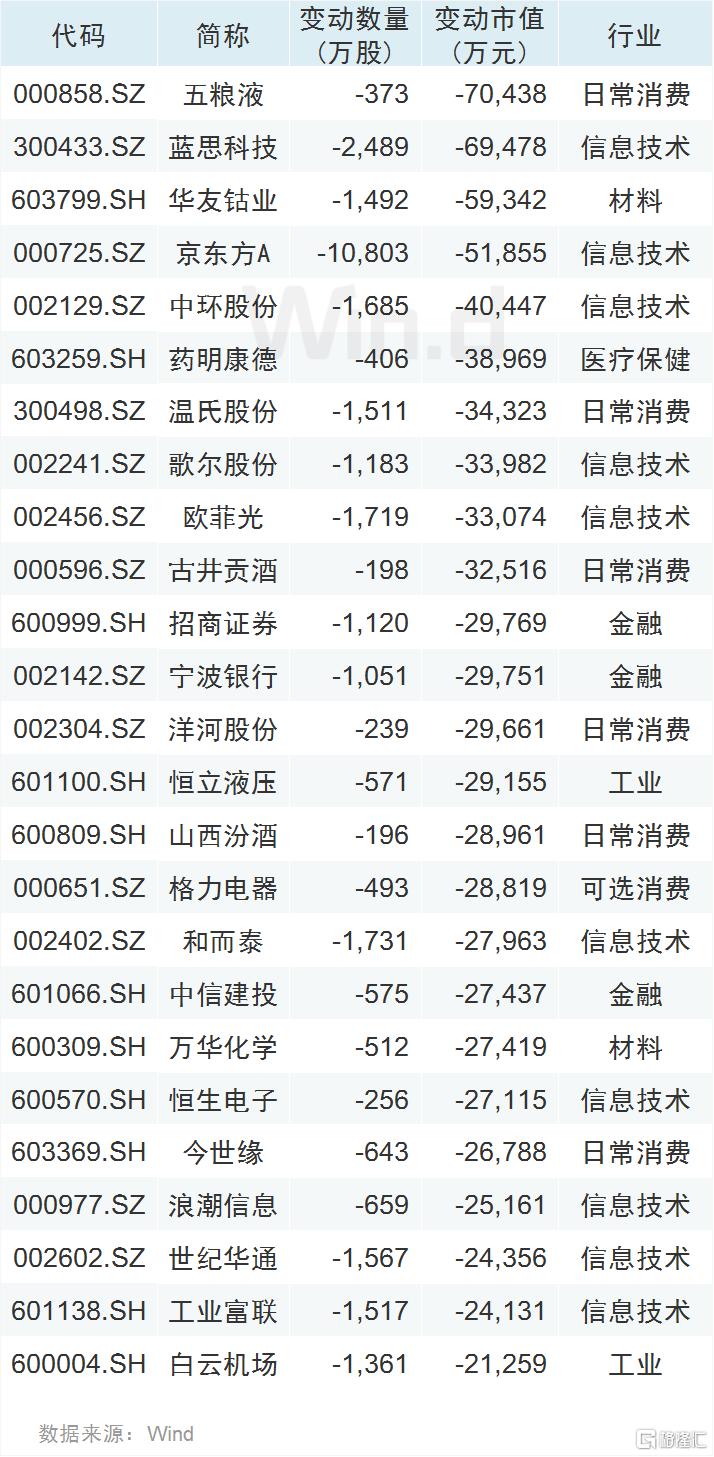
北上資金在加倉的同時,也對部分消費和信息技術板塊個股進行了調倉。Wind統計顯示,有25家公司減倉金額超過2億元,其中,淨賣出金額最多的是五糧液,超7億元;此外,藍思科技、華友鈷業、京東方A、中環股份、藥明康德、温氏股份、歌爾股份、歐菲光、古井貢酒淨賣出均超3億元。從淨賣出金額較高的公司來看,短線漲幅較大的股及估值偏高的股成為賣出目標。
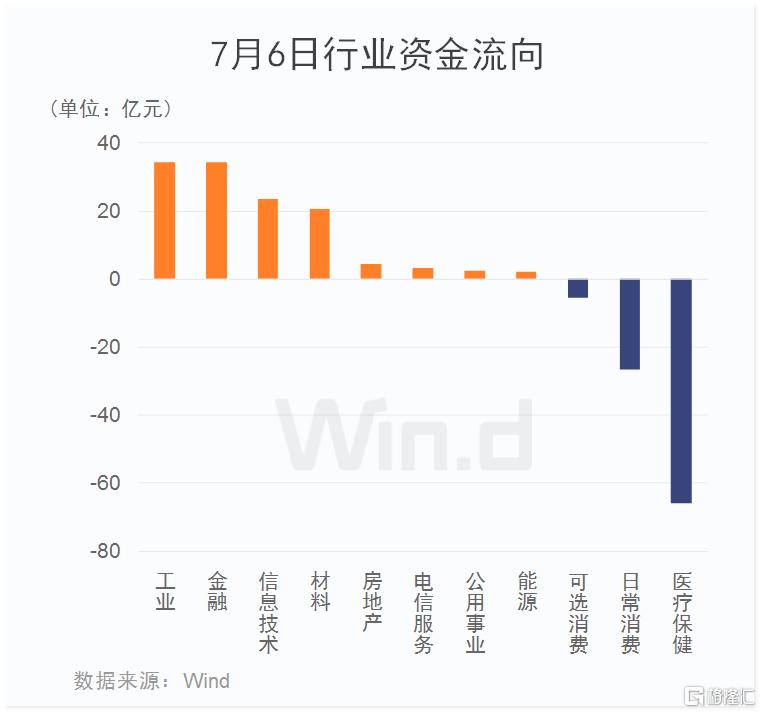
工業、金融板塊資金大幅流入
從7月6日行業資金流向來看,主力資金淨流出20多億元,板塊分化明顯。工業、金融板資金淨流入超30億元;而醫療保健板塊資金淨流出超60億元,日常消費板塊資金淨流出亦較多。
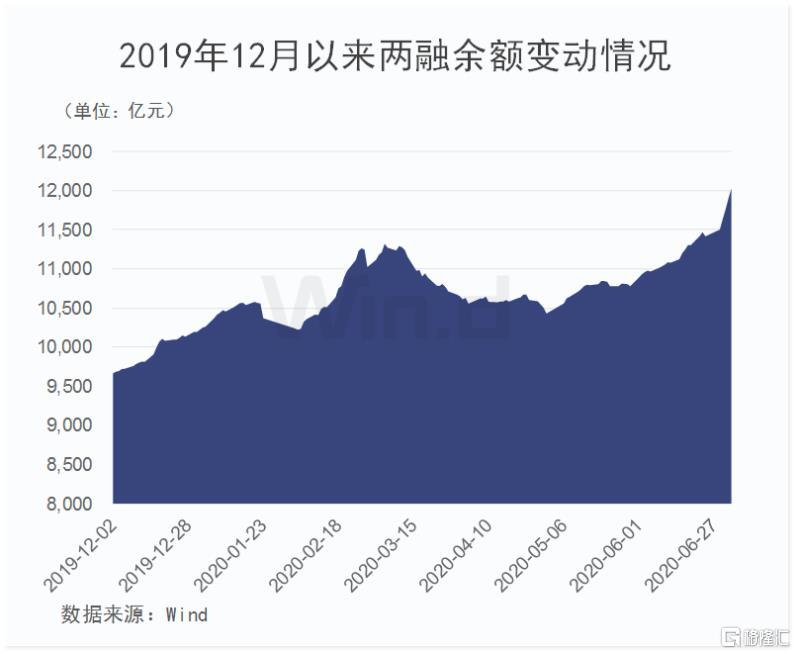
兩融餘額周增600億
近期,兩融餘額快速增長。截至7月3日,滬深兩市兩融餘額合計12028.68億元,較前一交易日增加125.52億元,上週已連續4天單日增幅超100億元,累計增長超600億元。
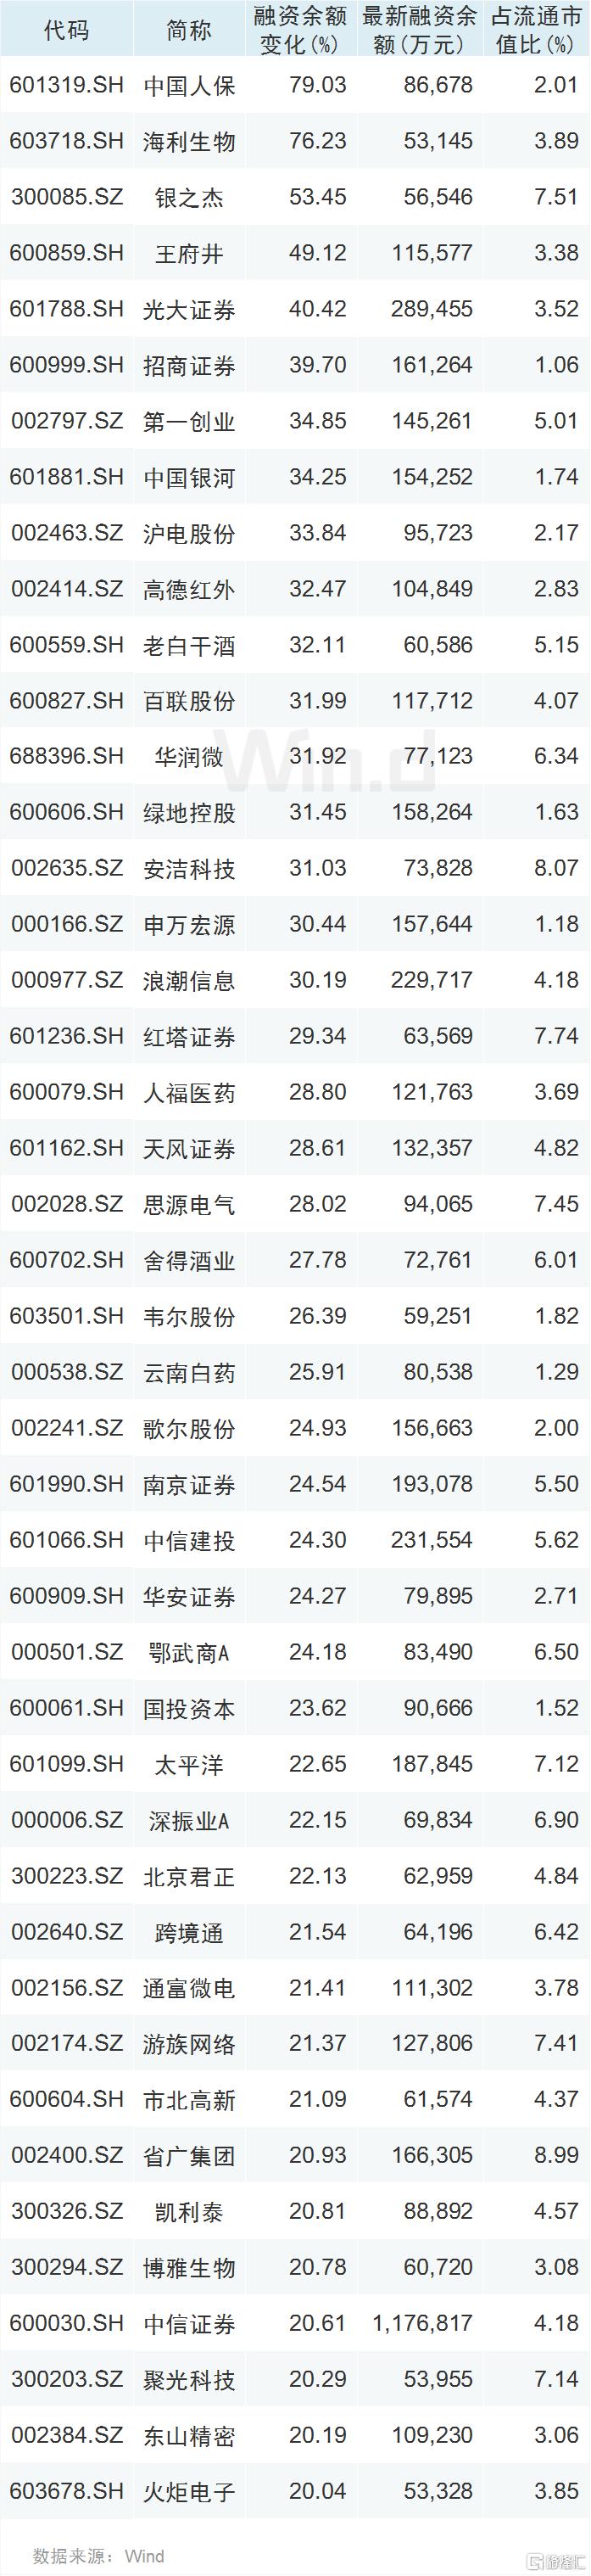
與此同時,部分公司融資餘額大幅攀升。Wind統計顯示,上週,有44只個股融資餘額增長超過20%、最新融資餘額超5億元,且佔流通市值比超過1%。具體來看,中國人保融資餘額增幅達79.03%,位居第一;此外,海利生物、銀之傑、王府井、光大證券、招商證券、第一創業、中國銀河、滬電股份、高德紅外、老白乾酒等家公司融資餘額增幅均超過30%。
Follow us
Find us on
Facebook,
Twitter ,
Instagram, and
YouTube or frequent updates on all things investing.Have a financial topic you would like to discuss? Head over to the
uSMART Community to share your thoughts and insights about the market! Click the picture below to download and explore uSMART app!

Disclaimers
uSmart Securities Limited (“uSmart”) is based on its internal research and public third party information in preparation of this article. Although uSmart uses its best endeavours to ensure the content of this article is accurate, uSmart does not guarantee the accuracy, timeliness or completeness of the information of this article and is not responsible for any views/opinions/comments in this article. Opinions, forecasts and estimations reflect uSmart’s assessment as of the date of this article and are subject to change. uSmart has no obligation to notify you or anyone of any such changes. You must make independent analysis and judgment on any matters involved in this article. uSmart and any directors, officers, employees or agents of uSmart will not be liable for any loss or damage suffered by any person in reliance on any representation or omission in the content of this article. The content of the article is for reference only and does not constitute any offer, solicitation, recommendation, opinion or guarantee of any securities, virtual assets, financial products or instruments. Regulatory authorities may restrict the trading of virtual asset-related ETFs to only investors who meet specified requirements. Any calculations or images in the article are for illustrative purposes only.
Investment involves risks and the value and income from securities may rise or fall. Past performance is not indicative of future performance. Please carefully consider your personal risk tolerance, and consult independent professional advice if necessary.


