港股石油板塊表現強勢!國際油價連續四日上漲釋放利好
6月3日,在港股市場上,石油股集體強勢,其中,中海油田服務領漲,漲超4%,中國海洋石油、中國石油化工股份漲超3%, 中國石油股份、崑崙能源等紛紛拉昇。
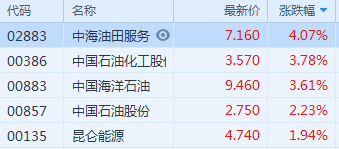
來源於:富途牛牛
而究及這一漲勢的原因,主要是源於近期國際油價的走穩拉昇。
在隔夜美股收漲之下,由於市場對主要產油國在本週舉行的視頻會議上同意延長減產協議執行期加以期待,且重啟經濟相繼開啟,國際油價連續第四個交易日上漲,刷新近三個月新高,截至收盤,WTI原油近月合約收漲逾3%。目前,WTI原油近月合約漲超2%,布倫特原油近月合約漲超1.4%。
來源於:英為財情
同時,根據美國石油協會(API)公佈的數據顯示,截至5月29日,當週API原油庫存意外減少48.3萬桶,預期增加330萬桶;汽油庫存增加170.6萬桶;精煉油庫存增加591.7萬桶;此外,俄羅斯5月石油產量為938.8萬桶/日,同比下降15.5%,環比下降17.2%,接近達到減產目標。
整體來看,基於疫情的轉好,產油國減產執行有效,原油過剩的擔憂有所減輕,使得油價得到有力支撐,走強明顯。
中信證券指出,當前國內疫情已經基本得到有效控制,伴隨全球疫情防控預計下半年石化下游需求逐步復甦,疊加OPEC+減產5月份生效,預計下半年國際油價企穩回升,年底布油有望回升至50美元/桶。油價觸底反彈通道中,煉廠庫存收益可觀,特別是民營大煉化業績將在Q1業績基礎上進一步提升;且傳統煉廠當前PB估值歷史最低水平,估值修復空間遠大於繼續下跌風險,高股息具有吸引力。
銀河證券指出,年初至今,石油化工行業收益率-13.93%,表現遜於整個市場,較全部A股低12.6個百分點;排在108個二級子行業的第93位。截至5月29日,石油化工板塊整體估值(PE(TTM))約為19.91x,顯著高於2014年初創下的8.87X最低水平,也略高於2009年以來的歷史均值(17.34X),主要受到一季度行業大幅虧損所致,看好下半年行業盈利預期改善帶來的投資機會。
Follow us
Find us on
Facebook,
Twitter ,
Instagram, and
YouTube or frequent updates on all things investing.Have a financial topic you would like to discuss? Head over to the
uSMART Community to share your thoughts and insights about the market! Click the picture below to download and explore uSMART app!

Disclaimers
uSmart Securities Limited (“uSmart”) is based on its internal research and public third party information in preparation of this article. Although uSmart uses its best endeavours to ensure the content of this article is accurate, uSmart does not guarantee the accuracy, timeliness or completeness of the information of this article and is not responsible for any views/opinions/comments in this article. Opinions, forecasts and estimations reflect uSmart’s assessment as of the date of this article and are subject to change. uSmart has no obligation to notify you or anyone of any such changes. You must make independent analysis and judgment on any matters involved in this article. uSmart and any directors, officers, employees or agents of uSmart will not be liable for any loss or damage suffered by any person in reliance on any representation or omission in the content of this article. The content of the article is for reference only and does not constitute any offer, solicitation, recommendation, opinion or guarantee of any securities, virtual assets, financial products or instruments. Regulatory authorities may restrict the trading of virtual asset-related ETFs to only investors who meet specified requirements. Any calculations or images in the article are for illustrative purposes only.
Investment involves risks and the value and income from securities may rise or fall. Past performance is not indicative of future performance. Please carefully consider your personal risk tolerance, and consult independent professional advice if necessary.


