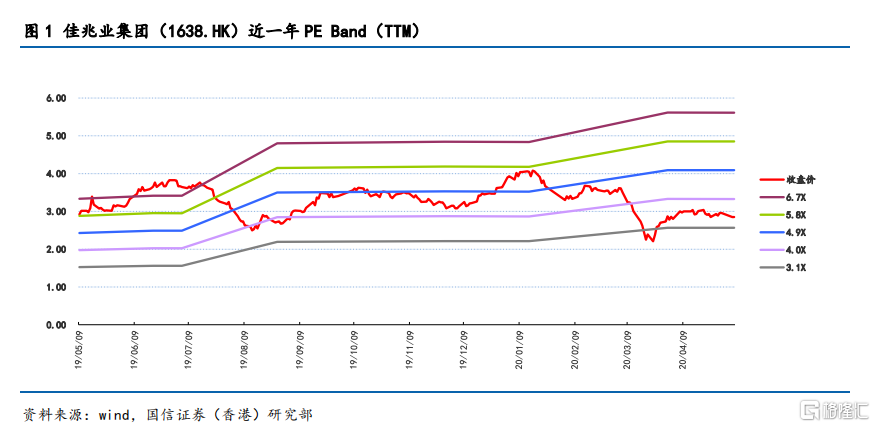
佳兆業集團(01638.HK):淨負債率持續改善,價值低估待修復,給予“買入”評級,目標價4.45港元
機構:國信證券
評級:買入
目標價:4.45港元
2019年業績穩步增長
截至2019年末,公司實現營業收入480.21億元,同比增長24.1%,歸母淨利潤45.94億元,同比增長67.1%,少數股東損益虧損4.3億元致使歸母淨利潤大幅增長。2019年公司整體毛利率為28.8%,銷售及管理費用率為11.14%,同比提升約1.2個百分點,但財務費用由2018年的25.73億元下降至16.15億元。2019公司淨利潤率為8.67%,較2018年小幅提升0.16個百分點,保持平穩。
2020年千億銷售規模可期
2019年公司合約銷售金額約為881.2億元,同比增長26%,合約銷售面積464.2萬平方米,同比增長21%,其中舊改項目銷售佔整體的38%,大灣區項目的銷售佔整體的61%。平均售價約為每平方米18983元,同比增長約4%。公司2017—2019年合同銷售金額分別為298億、447億、701億、881億元,三年複合增長(CAGR)達40%。公司2020年可售貨值1800億元,可售面積970萬平方米,公司今年銷售目標1000億元,對應去化率55.6%。一季度受疫情衝擊,公司合約銷售金額為115億元,過往公司一季度合約銷售金額僅佔公司全年銷售額的10%左右,佔比較低,我們預計2020年公司完成1000億的合約銷售的目標是大概率事件。
淨負債率持續改善,財務狀況向好發展
截至2019年末,公司有息負債為1172億元,平均融資成本為8.8%,淨負債率為144%。淨負債率雖仍處高位,但較2018年下降92個百分點,持續改善。淨負債率水平仍維持在較高水平主要由於公司舊改項目投入週期較長,轉化週期通常在5年左右。截至2019年末,公司在手現金大幅增長61%至370億元,速動比率維持在1.1的水平,短期流動性壓力並不大。
土地儲備豐富,坐擁大量優質舊改項目資源
截至2019年末,公司土地儲備約2677萬平方米(權益比約76%),預計現有土地儲備足夠公司未來五年的發展所需。土地儲備總貨值約為5275億元,其中大灣區貨值佔比為65.5%(深圳貨值佔比32.9%)。憑藉公司在城市更新方面的豐富經驗,公司目前於深圳、廣州及中山等大灣區市場內,坐擁大量優質舊改項目資源,截至2019年末,舊改土儲貨值約為2200億元,佔總貨值的42%。
投資建議
我們預計公司2020—2022年營業收入分別為630.53億元,781.86億元、946.05億元,歸母淨利潤分別為61.4億元、72.65億元、85.09億元,對應EPS分別為1.01元、1.19元、1.39元。我們認為,市場因為公司較高的淨負債率,對公司股價預期過分悲觀。公司土地儲備總貨值的65.5%位於大灣區,安全邊際較高,且公司擁有大量優質舊改項目資源儲備,市場對此未有充分反映,給予公司2020年PE4X,對應目標價4.45元,給予“買入”的投資評級。
風險提示
商品房銷售、舊改項目進展不及預期;負債結構優化低於預期;調控政策、融資環境超預期收緊;新冠疫情持續時間超預期。
Follow us
Find us on
Facebook,
Twitter ,
Instagram, and
YouTube or frequent updates on all things investing.Have a financial topic you would like to discuss? Head over to the
uSMART Community to share your thoughts and insights about the market! Click the picture below to download and explore uSMART app!

Disclaimers
uSmart Securities Limited (“uSmart”) is based on its internal research and public third party information in preparation of this article. Although uSmart uses its best endeavours to ensure the content of this article is accurate, uSmart does not guarantee the accuracy, timeliness or completeness of the information of this article and is not responsible for any views/opinions/comments in this article. Opinions, forecasts and estimations reflect uSmart’s assessment as of the date of this article and are subject to change. uSmart has no obligation to notify you or anyone of any such changes. You must make independent analysis and judgment on any matters involved in this article. uSmart and any directors, officers, employees or agents of uSmart will not be liable for any loss or damage suffered by any person in reliance on any representation or omission in the content of this article. The content of the article is for reference only and does not constitute any offer, solicitation, recommendation, opinion or guarantee of any securities, virtual assets, financial products or instruments. Regulatory authorities may restrict the trading of virtual asset-related ETFs to only investors who meet specified requirements. Any calculations or images in the article are for illustrative purposes only.
Investment involves risks and the value and income from securities may rise or fall. Past performance is not indicative of future performance. Please carefully consider your personal risk tolerance, and consult independent professional advice if necessary.


