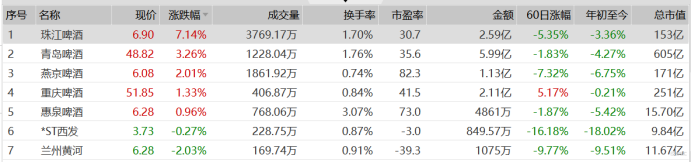
啤酒板塊逆勢走強,珠江啤酒大漲7%
今日,啤酒板塊走強,珠江啤酒(002461.SZ)大漲7%、青島啤酒(600600.SH)、重慶啤酒(600132.SH)、惠泉啤酒、燕京啤酒紛紛跟漲。
 來源:Wind
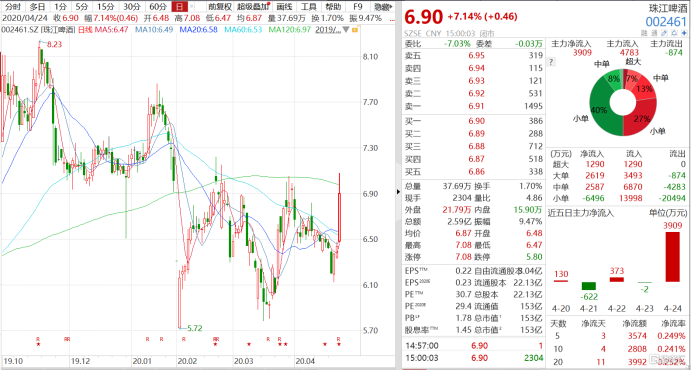
其中,珠江啤酒今日股價盤中走勢活躍一度漲停後回落,截至收盤,股價上漲7.14 %,報收6.9元/股,成交量37.69萬手,總市值152.72億元。
 來源:Wind
青島啤酒今日股價一度拉昇後震盪下行,截至收盤,股價上漲3.26 %,報收48.82元/股,市盈率36.61,成交額6億元,總市值659.55億元。
重慶啤酒今日股價明顯波動,截至收盤,股價上漲 1.33%,報收51.85元/股,市盈率41.45,成交額2.1億元,總市值250.94億元。
據國家統計局數據顯示,2020年1-2月中國啤酒產量為315.9萬千升,同比下降40%。川財證券對此表示,疫情對啤酒行業整體營業造成嚴重影響,但頭部廠商憑藉品牌、 渠道優勢抵抗疫情衝擊的韌性更強。
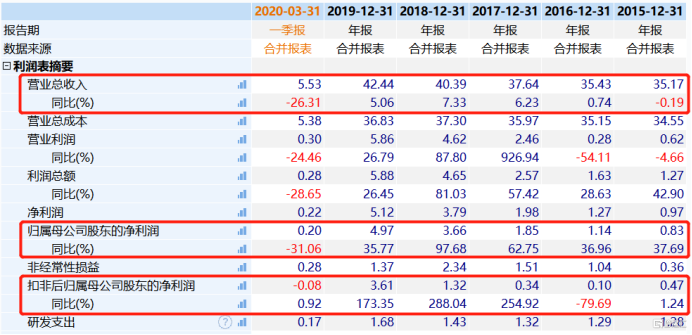
據業績報告來看,珠江啤酒2020年第一季度營收5.53億元,同比下降26.31%,歸母淨利潤0.2億元,同比下降31.06%,扣非歸母淨虧損0.08億元,同比增長0.92%。公司稱營收與淨利下滑主要歸因於受疫情影響。
 來源:Wind
青島啤酒2020年第一季度報預計在4月30日發佈。東莞證券表示,預計公司第一季度業績面臨較大下行壓力,其中,2020年1-2月公司收入和利潤分別同比下降20%、40%;受全球疫情影響,2020年3-4月公司海外訂單和出口量也出現大幅下滑。
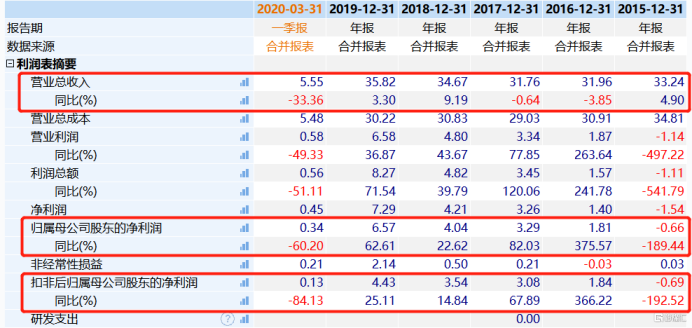
重慶啤酒2020年第一季度報營收5.55億元,歸母淨利潤0.34億元,扣非歸母淨利潤0.13億元,分別同比下降33.36%、60.2%、84.13%。公司稱收入和利潤的下降主要受疫情影響。
 來源:Wind
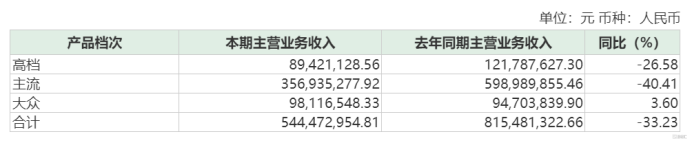
分產品檔次來看,其高檔產品銷售收入8942萬元,同比下降26.58%,主流產品銷售收入3.57億元,同比下降40.41%,大眾產品銷售收入9812萬元,同比增長3.6%
 來源:重慶啤酒2020年第一季度業績報告
就目前來看,國內疫情基本得到控制,各地政府紛紛出台提振餐飲和娛樂場所消費措施,疊加夏季啤酒消費旺季即將來臨,啤酒銷量有望觸底反彈。
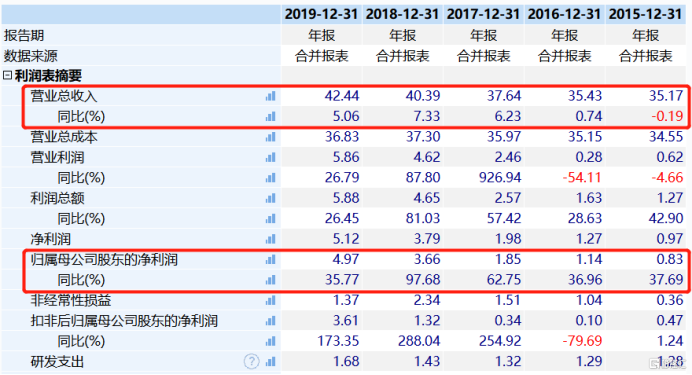
據年報來看,珠江啤酒2019年營收42.44億元,歸母淨利潤4.97億元,分別同比增長5.06%、35.77%。值得一提的是,其在今年的營收和淨利達到創上市以來最高值。
 來源:Wind
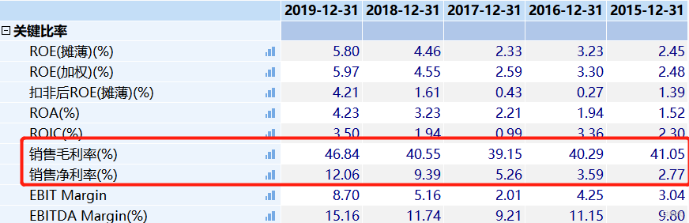
盈利方面,公司上年銷售毛利率12.06%,同比增長6.29%;同時,其銷售淨利率在2015-2019增長非常迅猛,分別為2.77%、3.59%、5.26%、9.39%、12.06%,與2015年相比,淨利率增長超3倍,盈利狀況很好。
 來源:Wind
青島啤酒2019年營收279.84億元,歸母淨利潤18.52億元,分別同比增長5.3%、30.23%。營收的增加主要受益於公司產品結構優化以及部分產品提價。
重慶啤酒2019年營收35.82億元,歸母淨利潤6.57億元,扣非歸母淨利潤4.43億元,分別同比增長3.3%、62.61%、25.11%。
此外,據川財證券表示,整體來看,2020年2月以來主要啤酒廠商加快復工復產,到3月產能已基本恢復正常運營。疫情在2月對整個國內啤酒行業的影響超過20%,3-5月將逐步恢復,下半年預計完全恢復。分渠道來看,預計餐飲市場在4月逐步開放,5月恢復正常;夜場渠道在4月開放進程相對較慢,完全恢復時間將會推遲。
Follow us
Find us on
Facebook,
Twitter ,
Instagram, and
YouTube or frequent updates on all things investing.Have a financial topic you would like to discuss? Head over to the
uSMART Community to share your thoughts and insights about the market! Click the picture below to download and explore uSMART app!

Disclaimers
uSmart Securities Limited (“uSmart”) is based on its internal research and public third party information in preparation of this article. Although uSmart uses its best endeavours to ensure the content of this article is accurate, uSmart does not guarantee the accuracy, timeliness or completeness of the information of this article and is not responsible for any views/opinions/comments in this article. Opinions, forecasts and estimations reflect uSmart’s assessment as of the date of this article and are subject to change. uSmart has no obligation to notify you or anyone of any such changes. You must make independent analysis and judgment on any matters involved in this article. uSmart and any directors, officers, employees or agents of uSmart will not be liable for any loss or damage suffered by any person in reliance on any representation or omission in the content of this article. The content of the article is for reference only and does not constitute any offer, solicitation, recommendation, opinion or guarantee of any securities, virtual assets, financial products or instruments. Regulatory authorities may restrict the trading of virtual asset-related ETFs to only investors who meet specified requirements. Any calculations or images in the article are for illustrative purposes only.
Investment involves risks and the value and income from securities may rise or fall. Past performance is not indicative of future performance. Please carefully consider your personal risk tolerance, and consult independent professional advice if necessary.


