深康佳A:2019年淨利大降48.45%,股價跌0.79%
21日晚,深康佳A發佈了2019年年報,公司上年度實現營收551.19億元,同比增長19.49%;淨利潤2.12億元,同比下降48.45%;基本每股收益0.0881元,擬向全體股東每10股派發現金紅利0.5元(含税)。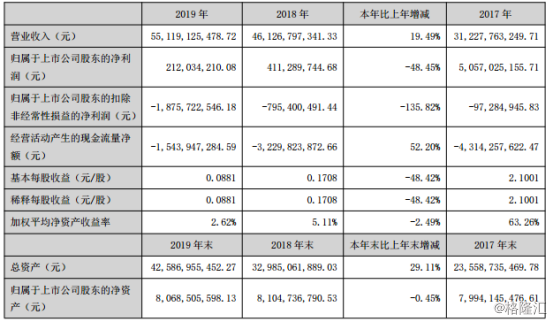
來源:深康佳A2019年年報
同期視聽器材行業平均營業收入增長率為3.38%,平均淨利潤增長率為154.77%。相比之下,深康佳A營收增長超過行業平均水平,但是淨利潤增長卻遠遠落後。
報告表示,淨利潤率大幅下跌的主要原因是公司彩電業務受成本上升、市場競爭加劇等因素影響,毛利率下降明顯。同時,報告期內公司投入研發費用共計5.01億元,同比增長26.27%。
深康佳A是康佳集團旗下的公司,歸屬視聽器材行業,主營彩電業務、手機業務、白電業務以及供應鏈貿易業務,2019年公司開始佈局半導體科技業務、移動互聯業務和PCB業務。
從產品方面來看,2019年公司主要營收來源工貿業務,收入佔比60%,彩電業務和環保業務相對薄弱,分別佔16%、13%,與2018年的22%、7%分別有所變化;從地區來看,公司以境外銷售為主,營收佔比超過60%。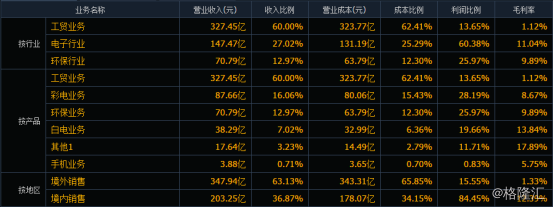
來源:同花順
值得關注的是,作為主要營收的工貿業務毛利率只有1.12%,雖然和2018年的0.99%相比有所上升,但是依然很小;另外,利潤佔比60%的電子行業毛利率從上一年度的14.52%下降到了11.04%,或許能夠解釋深康佳A營收增長但利潤下滑的異常表現。
股價走勢方面,今日早盤深康佳A低開拉昇後震盪下行,截止發稿,報價7.52元,下跌0.79%,最新總市值181.08億元。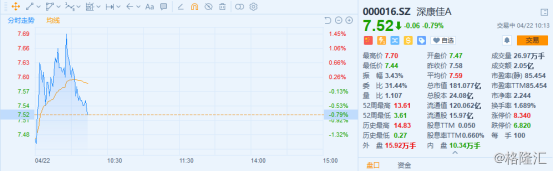
來源:富途
今年以來,深康佳A整體上漲超過73%,其中一季度上漲91.4%,經歷11次漲停。
但根據此前深康佳A發佈的業績預告,公司預計2020年一季度淨利潤-2.40億至-2.20億,同比變動-380.48%至-357.11%,基本每股收益-0.0997元至-0.0914元。
同時,公司表示擬在4月30日發佈2020一季度報告。
Follow us
Find us on
Facebook,
Twitter ,
Instagram, and
YouTube or frequent updates on all things investing.Have a financial topic you would like to discuss? Head over to the
uSMART Community to share your thoughts and insights about the market! Click the picture below to download and explore uSMART app!

Disclaimers
uSmart Securities Limited (“uSmart”) is based on its internal research and public third party information in preparation of this article. Although uSmart uses its best endeavours to ensure the content of this article is accurate, uSmart does not guarantee the accuracy, timeliness or completeness of the information of this article and is not responsible for any views/opinions/comments in this article. Opinions, forecasts and estimations reflect uSmart’s assessment as of the date of this article and are subject to change. uSmart has no obligation to notify you or anyone of any such changes. You must make independent analysis and judgment on any matters involved in this article. uSmart and any directors, officers, employees or agents of uSmart will not be liable for any loss or damage suffered by any person in reliance on any representation or omission in the content of this article. The content of the article is for reference only and does not constitute any offer, solicitation, recommendation, opinion or guarantee of any securities, virtual assets, financial products or instruments. Regulatory authorities may restrict the trading of virtual asset-related ETFs to only investors who meet specified requirements. Any calculations or images in the article are for illustrative purposes only.
Investment involves risks and the value and income from securities may rise or fall. Past performance is not indicative of future performance. Please carefully consider your personal risk tolerance, and consult independent professional advice if necessary.


