李寧(02331.HK):疫情期間表現優於市場,長期業績無虞 ,維持“強烈推薦” 評級
機構:方正證券
評級:強烈推薦
【事件】
2020年4月17日,公司發佈2020年一季度營運表現,李寧品牌(不包括李寧YOUNG)零售流水10%-20%高段下降,線下、電商渠道流水分別為20%-30%低段下降、10%-20%低段增長。
【點評】
流水:2020Q1流水錶現符合預期,優於市場。疫情影響下李寧線下門店均有階段性關閉,2020Q1李寧品牌(不包括李寧young)整體流水降幅為10-20%高段,符合預期。分渠道看,線下渠道下降幅度為20-30%低段,其中直營、批發分別下降30-40%中段、10-20%高段,電商渠道實現正增長,增速達10-20%低段,整體表現領先於其他內資品牌。
渠道:門店拓展放緩,關閉低店效門店優化渠道結構。截至2020年3月末,李寧主品牌門店總數、直營、加盟門店總數分別達6225家(較年初淨減少224家,同比-1.3%,後文同理)、1266家(淨減少26家,-9.6%)、4959家(淨減少198家,+1.0%),李寧YOUNG門店數達1026家(淨減少75家,+25.9%)。今年上半年開店計劃延後,2020Q1李寧及李寧young門店數量均有下滑。2020年公司將重點推進渠道及店鋪升級,繼續關閉低店效門店,增加高店效大店、中國李寧門店佔比,優化渠道結構。
2020展望:短期疫情影響銷售,全年淨利率有望維持,公司基本面優異,疫情下核心優勢繼續凸顯。
(1)業務模式:公司為單一品牌、多渠道、多品類、地域集中的業務模式,歐美區域在公司總銷售佔比不到1%,在全球疫情蔓延、中國區基本恢復的情況下防禦性較高。
(2)渠道方面:①推進渠道及店鋪升級,繼續將重心放於高店效店鋪建設,關閉低效及虧損店鋪,優化渠道結構,強化超一線、一二線城市渠道佈局。②推動終端店鋪建設,標準化李寧旗艦店店鋪,持續推進大店開設,細化大店模板,建立視覺營銷業務的業務體系(VMD)。③設立全渠道發展戰略,打通線上線下,渠道協同,公司將明確線上線下共通商品比例及線上專供款比例。
(3)成本方面:公司浮動和可控成本佔平台成本結構的45%(不包括半固定的員工成本),因此整體成本規模可控空間較大,且2、3月份租金約有30%的減免。資本開支方面目前預計保持5億,但是上半年的開店延後,下半年能否實現開店目標仍未知,預計2020年資本開支較5億下降10%。
(4)庫存方面:去年前三個季度公司持續優化渠道庫存結構,存貨及經銷商狀況在疫情下優勢明顯(2019年底渠道庫銷比為3.4,優於同行),此外公司將給予經銷商方面更多回扣幫助清庫存。
(5)品牌力:①產品方面:李寧持續加碼研發投入,五大品類均有新品不斷推出且市場反饋較好。2019年研發費率進一步提升至2.6%,年內運動時尚服裝產品的總銷量超過1200萬件,鞋方面盤古和極光兩款熱門產品總銷量都超過了40萬雙,公司整體新品售罄率3/6個月分別提升2.5pct/4.0pct。②營銷方面:公司持續贊助合作CBA、國家羽毛球隊、馬拉松等賽隊賽事,並根據中國李寧的運動時尚屬性先後登上紐約、巴黎時裝週,優質產品及針對性營銷提升品牌形象及曝光度。
2020年,在疫情影響下,公司收入預計仍望維持增長,因2019有超過2億一次性土地售賣收入,預計在高基數下,2020利潤增速仍望達持平或以上,扣除一次性非經營損益後的淨利率預計提升1個點以上至10~10.5%。
【投資建議】
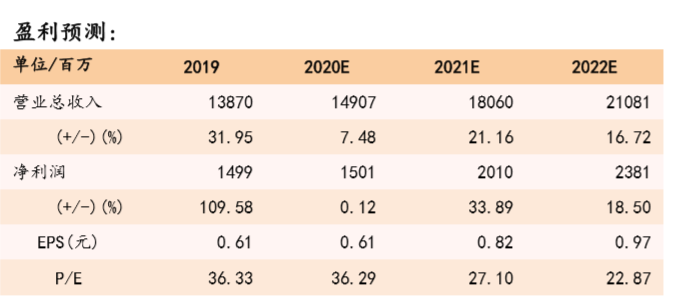
預計2020、2021、2022年公司歸母淨利潤分別為15.01、20.10、23.81億元,同比增速達0.12%、33.89%、18.50%,對應EPS為0.61、0.82、0.97元/股,對應P/E為36、27、23,給予“強烈推薦”評級。
【風險提示】
(1)經濟下滑超預期;(2)全球疫情控制不及預期;(3)童裝及中國李寧營業收入增長不及預期的風險。
Follow us
Find us on
Facebook,
Twitter ,
Instagram, and
YouTube or frequent updates on all things investing.Have a financial topic you would like to discuss? Head over to the
uSMART Community to share your thoughts and insights about the market! Click the picture below to download and explore uSMART app!

Disclaimers
uSmart Securities Limited (“uSmart”) is based on its internal research and public third party information in preparation of this article. Although uSmart uses its best endeavours to ensure the content of this article is accurate, uSmart does not guarantee the accuracy, timeliness or completeness of the information of this article and is not responsible for any views/opinions/comments in this article. Opinions, forecasts and estimations reflect uSmart’s assessment as of the date of this article and are subject to change. uSmart has no obligation to notify you or anyone of any such changes. You must make independent analysis and judgment on any matters involved in this article. uSmart and any directors, officers, employees or agents of uSmart will not be liable for any loss or damage suffered by any person in reliance on any representation or omission in the content of this article. The content of the article is for reference only and does not constitute any offer, solicitation, recommendation, opinion or guarantee of any securities, virtual assets, financial products or instruments. Regulatory authorities may restrict the trading of virtual asset-related ETFs to only investors who meet specified requirements. Any calculations or images in the article are for illustrative purposes only.
Investment involves risks and the value and income from securities may rise or fall. Past performance is not indicative of future performance. Please carefully consider your personal risk tolerance, and consult independent professional advice if necessary.


