佳兆業集團(01638.HK):淨負債率大幅改善,舊改轉換提速,維持“買入”評級,標價5.50港元
機構:西南證券
評級:買入
目標價:5.50港元
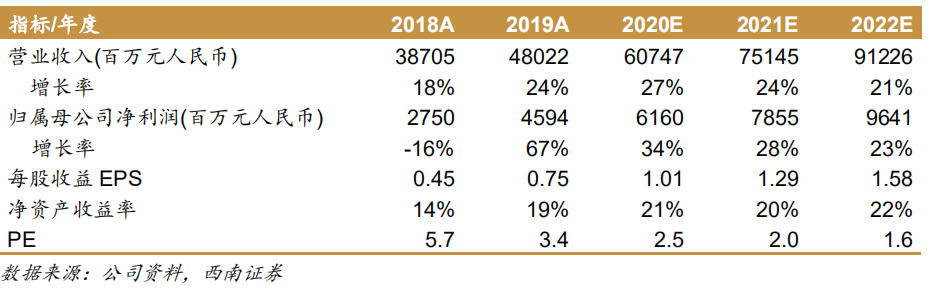
業績總結:公司]近日發佈2019年報,報告期實現營業收入480.2億,同比增長24.1%,實現歸母淨利潤45.9億,同比增長67.1%,建議派發期末股息每股10港仙,全年派息每股13港仙。
業績略超預期,淨利率穩中有升:報告期公司開發銷售結轉收入增長21.5%至438.5億,結轉毛利率保持穩定,毛利增長24.3%至138.3億,儘管銷售費率提高但財務費率有大幅回落,導致淨利潤增長26.4至41.6億,另外由於少數股東損益為負導致歸母淨利潤大增67.1%至45.9億,業績表現略超預期。整體毛利率為28.8%,淨利率為8.7%,相比2018年小幅提升0.2pp。
2020年推貨質量較高,1000億目標相對穩健:2019年公司實現權益合約銷售881.2億,同比增長25.8%,銷售單價18983元每平米,同比增長4.0%。從銷售貢獻來看,大灣區佔比61%,環渤海、華中、長三角和華西分別佔比13%、10%、9%和7%,按城市能級劃分一二線合計佔比90%。2020年公司可售貨值約1800億,其中大灣區佔比55%、長三角佔比22%,一線佔比37%、二線佔比52%,如按56%的去化率即可實現1000億的銷售目標。
舊改轉換提速,政策利好不斷:2019年9月以來政府持續出台了一些加快推進舊改的政策,公司新舊改資源的獲取、舊改向貨值的轉換均有提速。2019年公司新增權益土地建面367.5萬方,其中舊改項目佔比16%。截止2019年末,公司土儲2700萬方(權益76%),貨值5300億(大灣區佔比66%),其中舊改部分670萬方(含回遷房建安在內土地成本8200元每平米),另外公司舊改項目佔地面積同比增長33%至4000萬方,其中深圳和廣州各佔27%和36%。
淨負債率大幅改善,政策利好不斷:報告期末,公司淨負債率大幅降低92pp至144%,總體有息負債1172億,平均融資成本8.8%,其中境外佔比51%,一年內到期約61億人民幣,償付壓力並不大。
盈利預測與評級:預計公司2020-2022年EPS分別為人民幣1.01/1.29/1.58元,對應的動態市盈率為2.5/2.0/1.6倍。公司是大灣區舊改龍頭,持續受益區域市場和舊改政策利好,兼具負債改善彈性,我們給予公司2020年5倍PE估值,對應目標價5.50港元,維持“買入”評級。
風險提示:舊改轉換或低於預期,融資成本或居高不下等。
Follow us
Find us on
Facebook,
Twitter ,
Instagram, and
YouTube or frequent updates on all things investing.Have a financial topic you would like to discuss? Head over to the
uSMART Community to share your thoughts and insights about the market! Click the picture below to download and explore uSMART app!

Disclaimers
uSmart Securities Limited (“uSmart”) is based on its internal research and public third party information in preparation of this article. Although uSmart uses its best endeavours to ensure the content of this article is accurate, uSmart does not guarantee the accuracy, timeliness or completeness of the information of this article and is not responsible for any views/opinions/comments in this article. Opinions, forecasts and estimations reflect uSmart’s assessment as of the date of this article and are subject to change. uSmart has no obligation to notify you or anyone of any such changes. You must make independent analysis and judgment on any matters involved in this article. uSmart and any directors, officers, employees or agents of uSmart will not be liable for any loss or damage suffered by any person in reliance on any representation or omission in the content of this article. The content of the article is for reference only and does not constitute any offer, solicitation, recommendation, opinion or guarantee of any securities, virtual assets, financial products or instruments. Regulatory authorities may restrict the trading of virtual asset-related ETFs to only investors who meet specified requirements. Any calculations or images in the article are for illustrative purposes only.
Investment involves risks and the value and income from securities may rise or fall. Past performance is not indicative of future performance. Please carefully consider your personal risk tolerance, and consult independent professional advice if necessary.


