中國巨石2019年淨利潤21.29億元,增收不增利
來源:麪包財經
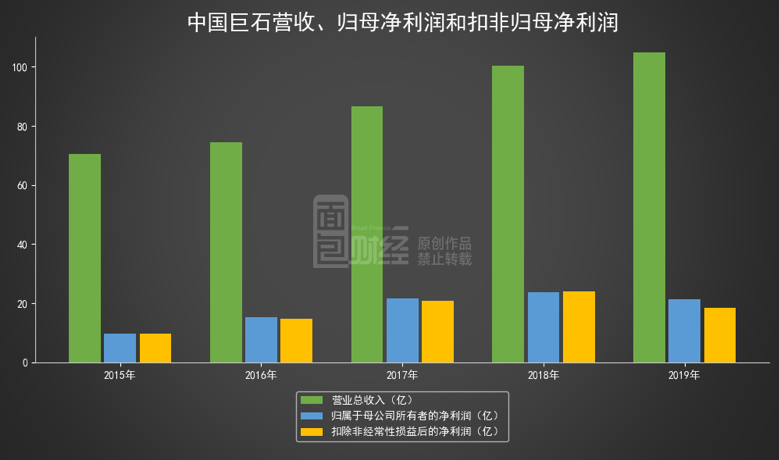
中國巨石(600176)於3月23日披露年報,公司2019年營業收入為104.93億元,同比增長4.59%;歸母淨利潤為21.29億元,同比下降10.33%;扣非歸母淨利潤為18.56億,同比下降22.51%。
2019年淨利潤21.29億元
財務數據顯示,中國巨石2019年出現增收不增利現象。
報告期內,公司營業收入較上年同期增加4.61億元,歸母淨利潤較上年同期減少2.45億元,扣非歸母淨利潤較上年同期減少5.39億元。本期非經常性損益為2.72億元,佔淨利潤的比例為12.89%。
中國巨石的淨利率水平也由2018年的23.66%下降至2019年的20.29%。
毛利率較上年同期下滑
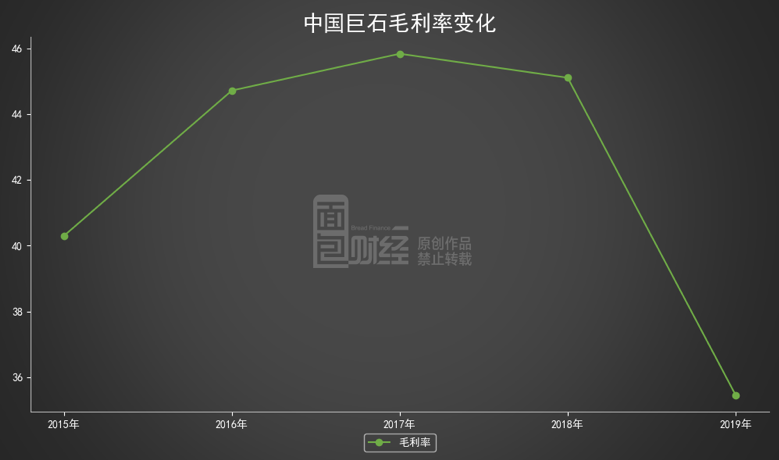
從業務盈利能力來看。中國巨石2019年營業收入增速為4.59%,營業成本增速為14.38%,營業成本增速超過同期營業收入增速。公司本期毛利率為35.46%,與上年同期相比下滑。
回顧公司以前業務盈利能力情況,2015年至2018年,中國巨石的毛利率分別為40.3%、44.72%、45.84%和45.11%。
期間費用率較上年同期下滑
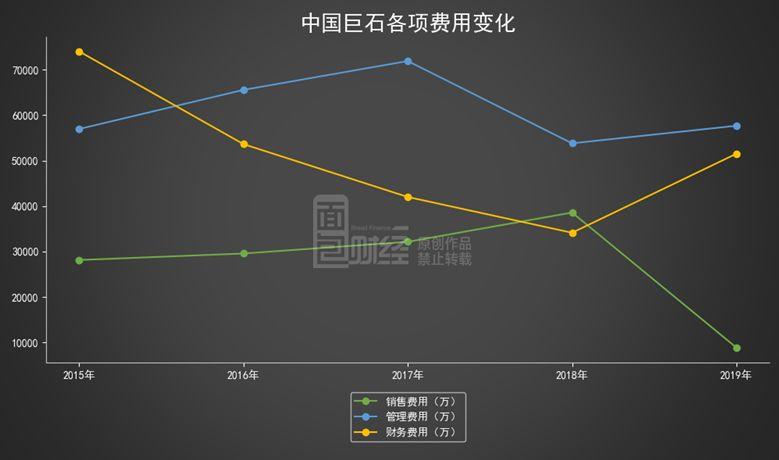
從公司期間費用水平來看,中國巨石2019年除研發費用以外的期間費用為11.8億元,同比下降6.69%,期間費用佔營業收入的比例為11.25%,與上年同期12.61%相比有所下滑。
具體來看,中國巨石2019年銷售費用為8830.94萬元,同比下降77.10%,銷售費用率為0.84%,與上年同期相比下降。
公司管理費用為5.77億元,同比上升7.2%,管理費用率為5.5%,與上年同期相比上升。
公司財務費用為5.15億元,同比增長51%,財務費用率為4.91%,與上年同期相比增長。
另外,財務數據顯示,中國巨石2019年的研發費用為2.84億元,同比下降1.72%,本期研發費用在營收中的佔比為2.7%。
對比去年研發費用情況來看,公司2018年研發費用為2.89億元,佔同期營業收入的比例為2.88%。
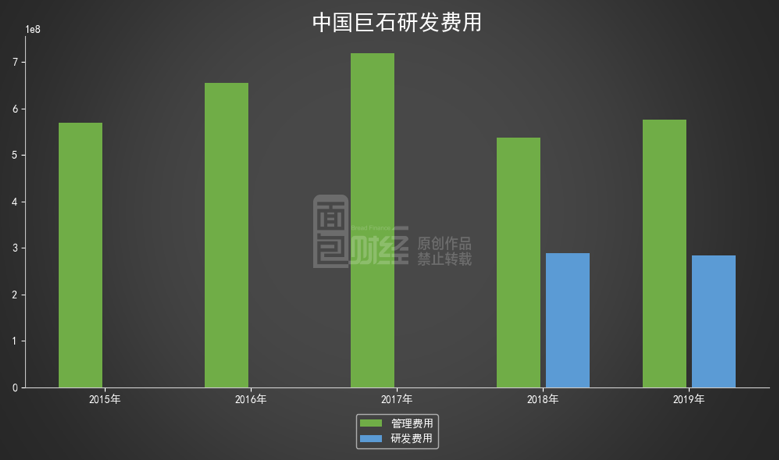
注:研發費用自2018年從管理費用中分離單獨列報
Follow us
Find us on
Facebook,
Twitter ,
Instagram, and
YouTube or frequent updates on all things investing.Have a financial topic you would like to discuss? Head over to the
uSMART Community to share your thoughts and insights about the market! Click the picture below to download and explore uSMART app!

Disclaimers
uSmart Securities Limited (“uSmart”) is based on its internal research and public third party information in preparation of this article. Although uSmart uses its best endeavours to ensure the content of this article is accurate, uSmart does not guarantee the accuracy, timeliness or completeness of the information of this article and is not responsible for any views/opinions/comments in this article. Opinions, forecasts and estimations reflect uSmart’s assessment as of the date of this article and are subject to change. uSmart has no obligation to notify you or anyone of any such changes. You must make independent analysis and judgment on any matters involved in this article. uSmart and any directors, officers, employees or agents of uSmart will not be liable for any loss or damage suffered by any person in reliance on any representation or omission in the content of this article. The content of the article is for reference only and does not constitute any offer, solicitation, recommendation, opinion or guarantee of any securities, virtual assets, financial products or instruments. Regulatory authorities may restrict the trading of virtual asset-related ETFs to only investors who meet specified requirements. Any calculations or images in the article are for illustrative purposes only.
Investment involves risks and the value and income from securities may rise or fall. Past performance is not indicative of future performance. Please carefully consider your personal risk tolerance, and consult independent professional advice if necessary.


