維達國際(3331.HK)2019年報點評:電商渠道持續高增,2020仍享成本低位紅利,維持“強烈推薦”評級
機構:長城證券
評級:強烈推薦
業績整體符合預期,淨利潤同比增長 75.3%。2019 年營業收入同比增長 8%至 160.74 億港元,剔除匯率波動因素後同比增長 11.6%,分季度來看 Q1/ Q2/ Q3 / Q4 收入增速分別為 7.88% /7.29% /12.45% /5.15%。全年經營 溢利達 15.7 億港幣,同比增長 53.9%,分季度來看,Q1/ Q2/ Q3 /Q4 經營 溢利分別為 3.4/ 2.9/ 3.7 /5.8 億港元,同比增長 2.72%/ -7.37%/ 192.06%/ 130.38%。2019 年淨利潤達 11.38 億港元,同比增長 75.3%,H1/ H2 分別 為 4.4/ 7 億港元,同比增長 5.4%/ 201.1%。
紙巾業務、電商渠道增長靚麗,個護重獲正增長。分產品來看:紙巾業 務收入同比增長 9.4%至 132.5 億港元,剔除匯率波動因素後同比增長 13.3%,佔集團總收益的 82%(提升 1pcpt),高端產品如立體美及得寶 持續放量。個人護理業務收入達 28.2 億港元,同比增長 1.9%,剔除匯率 波動因素後同比增長 4.4%,經過產品本土化生產及優化設計,女性及失 禁護理業務重獲市場認可,錄得正增長。分渠道來看:EC/KA/2B/GT 同 比增長 25%/8%/1%/-1%達 46.6/40.2/24.1/49.8 億港元,其中公司優勢電商 渠道持續快速增長,為公司增長的核心驅動力,中國區來看電商渠道銷 售佔比已達 37%。KA、GT 渠道在電商品牌力釋放的帶動下,增速有所 修復;2B 渠道增速有所承壓,但北京大興機場訂單奠定公司商銷渠道的 高品質基礎,基於我國紙巾商銷渠道空間廣闊,修復調整後有望維持較 高增長。
紙巾業務盈利能力顯著修復,費用率控制有效。2019 年毛利率同比 +2.9pcpts 至 31%,分產品來看,木漿下跌及立體美、Tempo 等高端產品 放量帶動的紙巾業務盈利能力提升,是 2019 年公司盈利能力修復的主要 驅動力,紙巾業務毛利率同比+3.8pcpts 至 31.4%,營業利潤率+3.5pcpt 至 11.6%;個護業務再發力,預計產品加大讓利和市場促銷,毛利率同比 -1.3pcpts 至 29.1%,營業利潤率-1.4pcpts 至 6.6%。費用率來看,銷售費 用率與 2018 年持平,維持在 16%,管理費用率同比+0.2pcpts 至 5.3%。 受益於毛利率修復及費用控制,淨利率同比+2.7pcpts 至 7.1%。
運營質量向好,中國區紙巾市佔率提升。應收賬款週轉天數減少 1 天至42 天;木漿買方市場,應付賬款賬期增加 3 天至 90 天;成品週轉天數下 降 3 天至 46 天;公司減少長期借款,淨資產負債率由 54%下降至 39%。 根據 Kantar,公司紙巾業務於大陸的市佔率提升了 0.7pcpts 至 18.1%,隨 着消費升級持續,公司高端新品迭代推出及各個渠道齊頭並進,維達紙 巾的可持續增長有望持續。
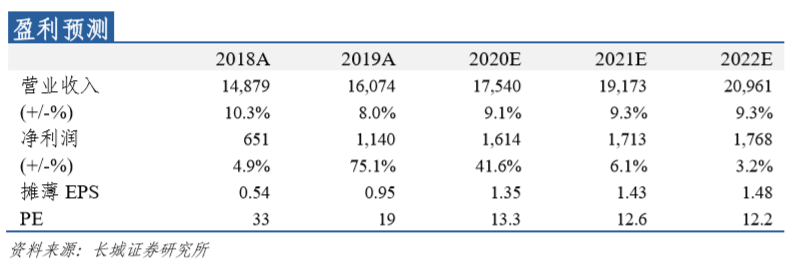
投資建議:新冠疫情期間,生活用紙需求穩定,公司的防禦配置價值凸 顯。同時,經濟衝擊下疊加原油價格暴跌,木漿價格有望進一步下探, 2020 年公司利潤端彈性仍可期。立足於優質的產品及強大的電商、商銷 渠道,公司的品牌力有望不斷提升。女性個護產品拐點初現,長期來看, 個護的培育有望在未來帶來新增盈利點,維達有望成長為亞洲個護用品 龍頭企業。預計 2020-2021 年 EPS 為 1.35、1.43 港元,對應 PE 為 13.3、 12.6x,維持“強烈推薦”評級。
風險提示:原材料價格上漲風險;產能釋放不及預期;行業產能擴張大 於需求,競爭加劇;擴品類推廣不及預期;營銷渠道建設不及預期。
Follow us
Find us on
Facebook,
Twitter ,
Instagram, and
YouTube or frequent updates on all things investing.Have a financial topic you would like to discuss? Head over to the
uSMART Community to share your thoughts and insights about the market! Click the picture below to download and explore uSMART app!

Disclaimers
uSmart Securities Limited (“uSmart”) is based on its internal research and public third party information in preparation of this article. Although uSmart uses its best endeavours to ensure the content of this article is accurate, uSmart does not guarantee the accuracy, timeliness or completeness of the information of this article and is not responsible for any views/opinions/comments in this article. Opinions, forecasts and estimations reflect uSmart’s assessment as of the date of this article and are subject to change. uSmart has no obligation to notify you or anyone of any such changes. You must make independent analysis and judgment on any matters involved in this article. uSmart and any directors, officers, employees or agents of uSmart will not be liable for any loss or damage suffered by any person in reliance on any representation or omission in the content of this article. The content of the article is for reference only and does not constitute any offer, solicitation, recommendation, opinion or guarantee of any securities, virtual assets, financial products or instruments. Regulatory authorities may restrict the trading of virtual asset-related ETFs to only investors who meet specified requirements. Any calculations or images in the article are for illustrative purposes only.
Investment involves risks and the value and income from securities may rise or fall. Past performance is not indicative of future performance. Please carefully consider your personal risk tolerance, and consult independent professional advice if necessary.


