天虹紡織(2678.HK):紗線業務承壓,但垂直一體化成果顯著,維持“買入”評級
機構:東吳證券
評級:買入
投資要點
事件:公司公佈 2019 年報,收入同增 14.9%至 220 億元,歸母淨利同降 24%至 8.84 億元,若剔除 2.09 億香港慶業的一次性收購利得以及政府補助、衍生品收益等 非經常性收益影響,19 年公司主業實際税前利潤下滑接近 50%,下滑主要與 19 年 中美貿易摩擦持續、棉價走低,導致公司紗線主業毛利率同比顯著下滑有關。
紗線主業:規模化發展持續,毛利率承壓。2019 年公司紗線產能達到 392 萬錠 (+12%),其中國內/越南分別增長 16%/7%至 245/147 萬錠;19 年受到中美貿易摩 擦影響,同時棉價持續低迷,公司為儘量保證產能飽滿運作,接單結構不如往年, 紗線產品平均單價下滑 5.3%至 2.23 萬元/噸,由此 2019 年紗線收入增長 7.5%至 167 億元,但毛利率同比下滑 4.4pp 至 13.5%,致毛利潤同比下滑 19%至 22.6 億元,拖 累整體利潤表現。
下游垂直一體化業務:梭織、針織面料業務團隊成熟,下游收入佔比提升至 24%, 盈利能力上升明顯。公司 2014 年開始發展下游垂直一體化業務,2019 年下游業務 收入規模合計已經達到 53 億元,同比增長 47%,貢獻毛利潤 7.37 億元,同比增長 105%。具體來看: 1)坯布業務:自用比例加大,由此對外銷量由 9600 萬米下降到 7920 萬米,收入 7.1 億元,受惠於垂直整合,毛利率由 14.8%上到 17.2%; 2)梭織面料業務:19 年初完成整合香港慶業,銷量達到 1.49 億米(自產 1 億米左 右,低於此前 1.2 億米預期,主要由於 4-5 月整合初期磨合;另外貿易銷售有 4000 萬米左右),收入達到 26.94 億元(+140%);受益於慶業團隊帶來的管理提升,毛 利率從 7.7%上升到到 16.6%; 3)針織面料業務:收入同比增長 12.6%至 9.0 億元,銷量 18230 噸(+8.8%), 但毛 利率同比下降 1.8pp 到 12.7%,主要和珠海工廠管理磨合有關,19 年 8 月重整管理 人才團隊,19Q4 毛利率已經高於去年平均水平,20 年希望陸續體現整合效果; 4)牛仔褲業務:收入 9.83 億元(+19.6%),銷量 1700 萬條(+10%) ,毛利率從 3.7% 上升到 5.4%;考慮盈利能力, 19Q4 公司關閉柬埔寨工廠,僅留下盈利的越南工廠 進行進一步發展。
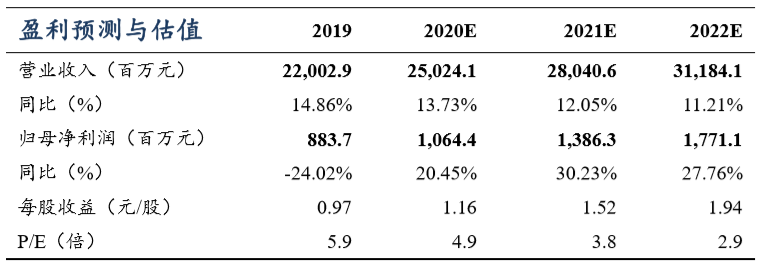
盈利預測及投資建議:截至 3 月初公司除新疆工廠外其他工廠全部正常運營(新疆 產能恢復 7 成左右)。2020 年考慮疫情帶來的影響,公司預計將重心放在已有產能 的充分利用以及下游業務的進一步整合和管理效率提升,從銷量計劃來看,預計 2020 年紗線 83 萬噸(+10.7%) ,坯布 6000 萬米(-24%,減少的原因是自用比例增 大), 梭織面料 1.4 億米(指自產部分,增 30%+;另貿易部分預計與 19 年相同, 在 3000-4000 萬米) ,針織面料 2.5 萬噸(+37%) ,牛仔褲 1400 萬條(-18%,集中 越南產能)。考慮紗線業務毛利率的小幅度恢復以及下游垂直一體化業務的盈利能 力提升,我們預計公司 2020/21/22 年歸母利潤同增 20.5%/30.2%/27.8%至 10.6/13.9/17.7 億元,對應估值 4.9/3.8/2.9X,作為管理高效、垂直一體化戰略逐漸成 型的全球化紡織龍頭,繼續看好,維持“買入”評級。
風險提示:貿易摩擦加劇、棉花價格意外波動、匯率價格出現劇烈變化、下游業 務拓展不及預期
Follow us
Find us on
Facebook,
Twitter ,
Instagram, and
YouTube or frequent updates on all things investing.Have a financial topic you would like to discuss? Head over to the
uSMART Community to share your thoughts and insights about the market! Click the picture below to download and explore uSMART app!

Disclaimers
uSmart Securities Limited (“uSmart”) is based on its internal research and public third party information in preparation of this article. Although uSmart uses its best endeavours to ensure the content of this article is accurate, uSmart does not guarantee the accuracy, timeliness or completeness of the information of this article and is not responsible for any views/opinions/comments in this article. Opinions, forecasts and estimations reflect uSmart’s assessment as of the date of this article and are subject to change. uSmart has no obligation to notify you or anyone of any such changes. You must make independent analysis and judgment on any matters involved in this article. uSmart and any directors, officers, employees or agents of uSmart will not be liable for any loss or damage suffered by any person in reliance on any representation or omission in the content of this article. The content of the article is for reference only and does not constitute any offer, solicitation, recommendation, opinion or guarantee of any securities, virtual assets, financial products or instruments. Regulatory authorities may restrict the trading of virtual asset-related ETFs to only investors who meet specified requirements. Any calculations or images in the article are for illustrative purposes only.
Investment involves risks and the value and income from securities may rise or fall. Past performance is not indicative of future performance. Please carefully consider your personal risk tolerance, and consult independent professional advice if necessary.


