丸美股份(603983.SH):財務估值模型
勾股大數據-丸美股份估值模型(點擊下載)
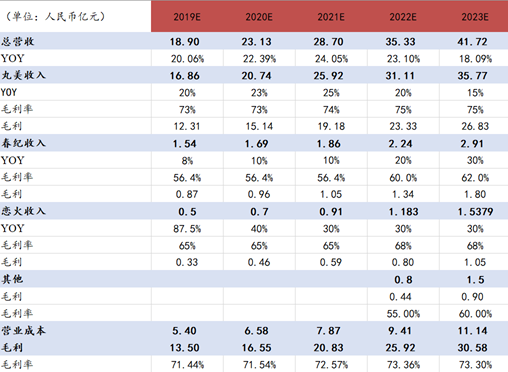
丸美股份2000年成立以來主要專注於附加值較高的眼部護理領域,盈利能力與國內其他化粧個護上市公司一直較強。公司產品包含眼部護膚、肌膚清潔、膏霜乳液、面膜及彩粧等多品類,眼部護膚類產品收入佔總收入的三分之一左右。
公司旗下有三個子品牌:主品牌丸美、主打大眾養生系列的春紀及彩粧品牌戀火。主品牌丸美一直佔收入的較高比重,常年保持在85%以上,2019年上半年佔比超過90%。公司的明星產品“彈力蛋白眼精華”等均出自丸美品牌。此外,公司自2016年開始佈局附加值更高的“丸美東京”系列,2018年該系列產品陸續上市後進一步提升了產品的價格帶和競爭力。作為目前國內少數可在細分領域與國際化粧品牌抗衡的國牌,我們認為丸美股份在較長時期內會保持並擴大自己的優勢。
業務預測的思路如下:
1)丸美:品牌知名度已經確立,優勢較為明顯,在“丸美東京”高客單價系列的帶動下,整體毛利率將繼續提升。
2)春紀:經歷2018年代銷渠道終止,2019年調整產品定位業績緩慢復甦。
3)戀火:品牌發展初期保持較高增速。
4)結合同行業發展情況,我們假設丸美股份會逐步收購或內部孵化其他品牌,列入“其他”類項目。
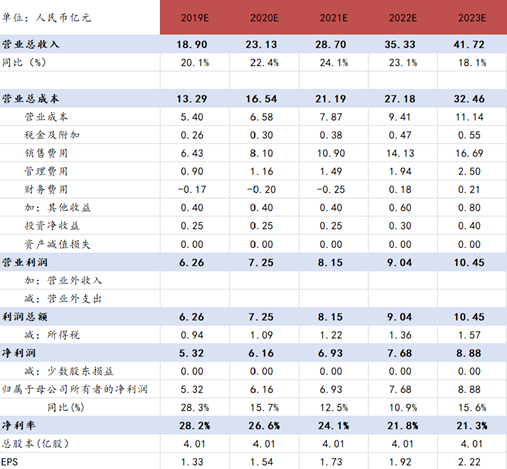
公司的銷售費用率及研發費用率將隨着新品的推出和品類的拓展有所提升,受此影響公司的淨利率將有所下降。
根據DCF估值結果,丸美股份市場價格相對其內在價值存在約16%的溢價,按DCF估值結果計算,其對應2019年EPS的估值約為40倍。
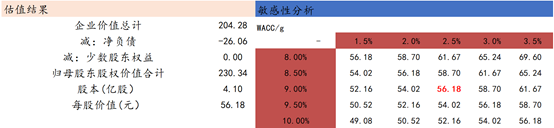
本模型展示了我們對於丸美股份未來發展的一種理解,不作為任何投資依據。各位用户可根據自己對公司發展的推測,自行設置參數調整估值模型。關於公司具體的定性分析可參考早前發佈的個股研究。
利益聲明:
本文所有分析僅為個人分享交流,並不構成對具體證券買賣建議,文中分析和建議不代表任何機構利益,同時可能存在觀點有偏情況,僅供分享和參考。各投資人需要慎重考慮文中分析和建議是否符合自身特定狀況,自主作出投資決策並自行承但投資風險。
Follow us
Find us on
Facebook,
Twitter ,
Instagram, and
YouTube or frequent updates on all things investing.Have a financial topic you would like to discuss? Head over to the
uSMART Community to share your thoughts and insights about the market! Click the picture below to download and explore uSMART app!

Disclaimers
uSmart Securities Limited (“uSmart”) is based on its internal research and public third party information in preparation of this article. Although uSmart uses its best endeavours to ensure the content of this article is accurate, uSmart does not guarantee the accuracy, timeliness or completeness of the information of this article and is not responsible for any views/opinions/comments in this article. Opinions, forecasts and estimations reflect uSmart’s assessment as of the date of this article and are subject to change. uSmart has no obligation to notify you or anyone of any such changes. You must make independent analysis and judgment on any matters involved in this article. uSmart and any directors, officers, employees or agents of uSmart will not be liable for any loss or damage suffered by any person in reliance on any representation or omission in the content of this article. The content of the article is for reference only and does not constitute any offer, solicitation, recommendation, opinion or guarantee of any securities, virtual assets, financial products or instruments. Regulatory authorities may restrict the trading of virtual asset-related ETFs to only investors who meet specified requirements. Any calculations or images in the article are for illustrative purposes only.
Investment involves risks and the value and income from securities may rise or fall. Past performance is not indicative of future performance. Please carefully consider your personal risk tolerance, and consult independent professional advice if necessary.


