海底撈(6862.HK):財務估值模型
勾股大數據-海底撈財務估值模型(點擊下載)
海底撈是全球領先、快速增長的中式餐飲品牌,主打火鍋品類。海底撈品牌在中式餐飲行業已經形成一種獨特的文化現象,成為極致服務體驗和就餐體驗的代名詞。公司通過“連住利益,鎖住管理”的管理理念,激發中基層員工的活力,保證公司實現快速擴張,2018年9月末成功登錄港股,2019年上半年,海底撈全球新開店130家,餐廳總數達593家(其中550家位於中國大陸116個城市)。火鍋中式餐飲由於標準化、易複製、受眾廣的特點,海底撈作為行業龍頭,發展有望更上一個台階。本估值模型將以海底撈的各線城市及海外的銷售數據作為預測基礎。
業務預測的思路如下:
(1)一線城市餐廳:未來三年仍舊快速開店擴張,搶佔市場,2018年海底撈的一線城市平均開店數約為5.6,預計2023年可達到12.7。受宏觀經濟影響,未來海底撈的翻枱率有所下降,整體人均消費金額從19年開始下降,2022年後開始有所回升。毛利水平隨着規模效應,有略微上升空間。
(2)二線城市餐廳:二線城市是公司的發展主體,餐廳數量18年末已達207家,平均單個城市達6.9家,未來5年有望提升至13.5,預計餐廳總數達400家。翻枱率、人均消費金額受宏觀經濟影響有所下降。毛利水平隨着規模效應,有略微上升空間。
(3)三線及以下城市餐廳:目前海底撈在三線市場的滲透率很低,18年末餐廳總數117家,而19年該類城市數量為288個,平均每城開店數僅0.4。預計未來5年開店總數有望突破300家。受宏觀經濟影響,預計公司的翻枱率、人均消費金額會有所下滑。毛利水平隨着規模效應,有略微上升空間。
(4)海外餐廳:海外市場整體有較大擴張空間,18年末海底撈海外餐廳總數為36家,預計未來5年有望突破110家。人均消費金額、翻枱率受經濟下行影響略有下滑。毛利水平隨着規模效應,有略微上升空間。
各線城市餐廳業務經營指標假設如下:

餐廳數量整體情況如下:

公司處於快速擴張期,成本控制有望繼續控制得當,各項費用率假設情況如下:

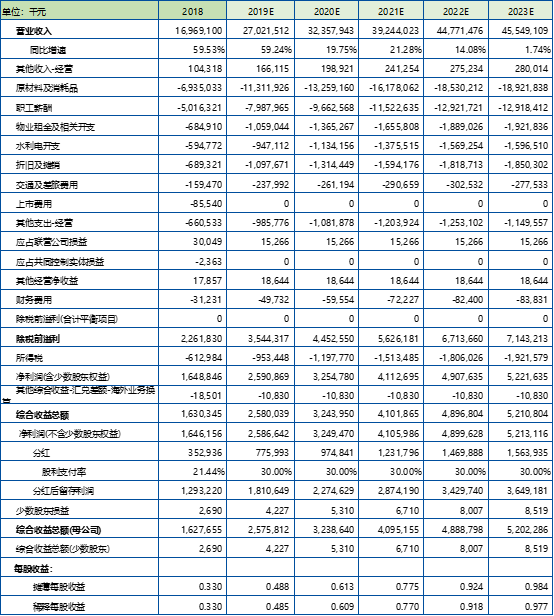
綜上,預計公司2019-2023年收入270/324/392/448/455億元,對應增速為59.2%/19.7%/21.3%/14.1%/1.7%,歸母淨利潤為25.8/32.3/41.0/48.9/52.0億元,對應增速為57.1%/25.6%/26.4%/19.3%/6.4%。
公司預測利潤表如下:
DCF估值假設:永續增長率為2.0%,無風險報酬率為3.21%,風險補償率為7.79%,則WACC為9.52%。根據敏感性分析得出估值區間為18.53-26.94元,對應2019年預測收益為37.97倍-55.20倍PE,根據目前最新股價,海底撈內在價值相對其目前股價的溢價率為-31.10%。


本模型展示了我們對於海底撈未來發展的一種理解,不作為任何投資依據。各位用户可根據自己對公司發展的推測,自行設置參數調整估值模型。
利益聲明:本文所有分析僅為分享交流,並不構成對具體證券的買賣建議,不代表任何機構利益,同時可能存在觀點有偏情況,僅供參考。各位讀者需慎重考慮文中分析是否符合自身特定狀況,自主作出投資決策並自行承擔投資風險。
Follow us
Find us on
Facebook,
Twitter ,
Instagram, and
YouTube or frequent updates on all things investing.Have a financial topic you would like to discuss? Head over to the
uSMART Community to share your thoughts and insights about the market! Click the picture below to download and explore uSMART app!

Disclaimers
uSmart Securities Limited (“uSmart”) is based on its internal research and public third party information in preparation of this article. Although uSmart uses its best endeavours to ensure the content of this article is accurate, uSmart does not guarantee the accuracy, timeliness or completeness of the information of this article and is not responsible for any views/opinions/comments in this article. Opinions, forecasts and estimations reflect uSmart’s assessment as of the date of this article and are subject to change. uSmart has no obligation to notify you or anyone of any such changes. You must make independent analysis and judgment on any matters involved in this article. uSmart and any directors, officers, employees or agents of uSmart will not be liable for any loss or damage suffered by any person in reliance on any representation or omission in the content of this article. The content of the article is for reference only and does not constitute any offer, solicitation, recommendation, opinion or guarantee of any securities, virtual assets, financial products or instruments. Regulatory authorities may restrict the trading of virtual asset-related ETFs to only investors who meet specified requirements. Any calculations or images in the article are for illustrative purposes only.
Investment involves risks and the value and income from securities may rise or fall. Past performance is not indicative of future performance. Please carefully consider your personal risk tolerance, and consult independent professional advice if necessary.


