TCL電子(1070.HK)海外市場節節攀升,首三季度出貨量穩居全球前二
近日,羣智諮詢公佈了2019年首三季度全球前十TV品牌出貨量市佔率的排名情況,據其最新數據顯示,全球TV品牌的前三位仍然由三星、TCL及LG三家廠商所牢牢佔據。
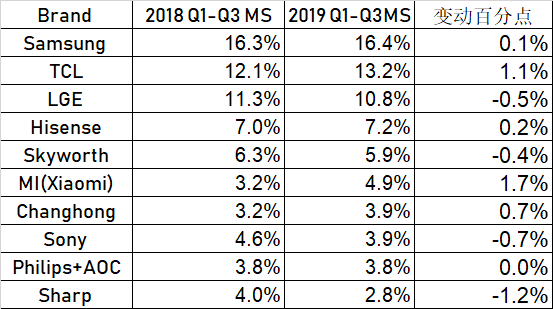
(數據來源:羣智諮詢)
其中,格隆匯留意到,穩居全球出貨量第二位的TCL,2019年前三季度全球市佔率為13.2%,同比增加1.1個百分點,持續提升顯著,在全球品牌前三位中提升幅度最大,頗有追趕爭奪第一寶座的趨勢。
反觀,全球排名第三的LG,全球市場份額同比萎縮了0.5個百分點;全球排名首位的三星亦裹足不前,前三季度的市場份額增長几乎陷入停滯。與此同時,2019年前三季度CR3的集中度為40.4% ,較2018年同期的39.7%,整體增加0.7個百分點,意味着全球TV行業中的CR3市場集中度提升的趨勢,目前正由TCL品牌所主導,其餘兩者(即三星與LG)在動態的競爭中,相對的市場份額正日益喪失。
從TCL電子近期公佈的業績數據可以瞭解到,海外市場的持續突破已經成為公司業務發展的重要驅動引擎,得益於海外市場綜合競爭力持續增強,TCL電子在上半年交出一份靚麗的成績單。由公司公佈的半年報數據顯示,TCL電子實現全球電視機整體銷售量高達1553萬台,同比增長17.9%,再創下歷史新高,市場佔有率保持全球第二。其中,2019年上半年,海外地區的TCL品牌電視機銷售量同比增長49.8%至707萬台,海外市場的經營業績同比更是大幅增長132.1%。
最後結合羣智諮詢公佈的最新數據可知,TCL電子在踏入第三季度後進一步發揮出公司在海外市場的綜合競爭優勢,進而其全球市佔率得到同比持續提升。2019年首三季度,TCL品牌電視機在美國的銷量市佔率同比提升3.3個百分點,穩居前二。歐洲市場中西班牙、意大利、法國、德國首三季度銷量明顯增長,分別快速增長247%、236%、108%及101%。新興市場方面,TCL品牌電視機首三季度銷量同比增長36.5%,第三季度增幅更是超過50%,其中快速增長區域包括印度、阿根廷、澳大利亞、印尼、巴西和俄羅斯,銷量增幅分別達到191%、99%、69%、55%、47%及34%,在巴西和印度電視機銷售量市佔率排名前五,澳大利亞銷售量市佔率在第三季度更一躍攀升至第一。在全球市場份額的相對競爭中,TCL電子錶現突出,相信公司在未來的業績表現也會保持良好的增長速度,印證公司全球擴張的步伐和潛力正在釋放。
Follow us
Find us on
Facebook,
Twitter ,
Instagram, and
YouTube or frequent updates on all things investing.Have a financial topic you would like to discuss? Head over to the
uSMART Community to share your thoughts and insights about the market! Click the picture below to download and explore uSMART app!

Disclaimers
uSmart Securities Limited (“uSmart”) is based on its internal research and public third party information in preparation of this article. Although uSmart uses its best endeavours to ensure the content of this article is accurate, uSmart does not guarantee the accuracy, timeliness or completeness of the information of this article and is not responsible for any views/opinions/comments in this article. Opinions, forecasts and estimations reflect uSmart’s assessment as of the date of this article and are subject to change. uSmart has no obligation to notify you or anyone of any such changes. You must make independent analysis and judgment on any matters involved in this article. uSmart and any directors, officers, employees or agents of uSmart will not be liable for any loss or damage suffered by any person in reliance on any representation or omission in the content of this article. The content of the article is for reference only and does not constitute any offer, solicitation, recommendation, opinion or guarantee of any securities, virtual assets, financial products or instruments. Regulatory authorities may restrict the trading of virtual asset-related ETFs to only investors who meet specified requirements. Any calculations or images in the article are for illustrative purposes only.
Investment involves risks and the value and income from securities may rise or fall. Past performance is not indicative of future performance. Please carefully consider your personal risk tolerance, and consult independent professional advice if necessary.


