康德萊醫械(01501.HK)首日掛牌 高開29.81%
IPO那點事(ID:ipopress):康德萊醫械(01501.HK)首日掛牌,截至9時20分,漲29.81 %,報價27港元 ,成交額2.09億港元 ,最新市值43.2億港元。
公告顯示,康德萊醫械全球發售4000萬股,其中國際發售2000萬股佔50%,香港發售2000萬股佔50%;每股定價20.80港元,為招股價範圍(20.10港元至20.80港元)上限,集資淨額7.58億港元;今日掛牌。
該公司公開發售合共接獲約4.21萬份有效申請,認購合共約10.72億股公開發售股份,相當於公開發售項下初步可供認購香港發售股份總數400萬股的約267.97倍。國際發售項下初步提呈發售的發售股份已獲超額認購國際發售項下初步可供認購國際發售股份總數3600萬股的約9.6倍。
IPO那點事(ID:ipopress)瞭解到,康德萊醫械是中國領先的心內介入器械製造商。該公司的主要產品(包括球囊擴張壓力泵、導管鞘套裝、造影導絲、動脈壓迫止血帶、Y型連接器套裝、壓力延長管、三通旋塞及造影導管)主要用於心血管介入手術(特別是PCI手術)。根據弗若斯特沙利文,按2018年銷售收入計,其在中國PCI支援器械市場的國產品牌中排名第一(在所有品牌中排名第七,市場份額為3.1%),在中國冠狀動脈介入器械市場的國產品牌中排名第二(在所有品牌中排名第十,市場份額為1.8%)。
該公司的歷史可追溯到2006年,當時該公司是由公司其中一名控股股東康德萊(603987.SH)與獨立第三方大連健康島科技有限公司合資成立的合營企業,以開發若干醫療器械。
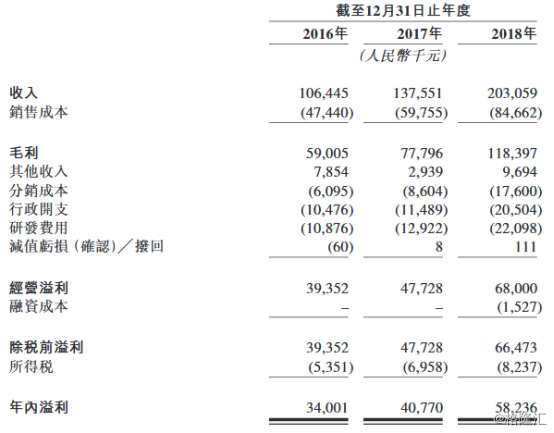
於2016年、2017年及2018年,該公司總收入分別為人民幣1.06億元(單位下同)、1.38億元及2.03億元,2016年至2018年的複合年增長率為38.1%,而淨利潤分別為3400萬元、4080萬元及5820萬元,同期的複合年增長率為30.9%。
同期,毛利率方面分別為55.4%、56.6%及58.3%,毛利率持續上升受惠於介入醫療器械的銷售佔比從76.5%增至91.1%,其中心血管的醫械毛利率約65%、骨科的醫械毛利率約80%;淨利率方面分別為31.9%、29.6%、28.7%及36.0%,下降由於行政及研發開支持續上升所致。
其中,絕大部分總收益來自銷售其公司的心內介入醫療器械,而剩餘部分來自銷售醫療標準件或其他產品。2016-2018年,來自介入醫療器械收益佔總收入76.5%、79.7%及87.1%。
IPO那點事(ID:ipopress)獲悉,該公司主要採用向分銷商、醫療器械製造商及其客户的銷售模式,其中向分銷商銷售的佔比逐漸增加,截止19年前4個月佔比約52.8%;向中國分銷商進行的銷售分別產生31.0%、32.8%、41.4%及42.8%的收入,而來自向海外分銷商進行的銷售分別產生18.9%、14.2%、11.4%及9.9%的收入。
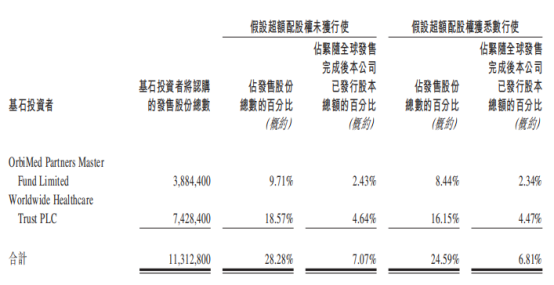
基石投資者方面,OrbiMed Partners Master Fund Limited;及Worldwide HealthcareTrust PLC均已分別認購388.44萬股發售股份及742.84萬股發售股份,總計1131.28萬股發售股份,合共佔緊隨全球發售完成後公司已發行股本總額的約7.07%;及全球發售項下發售股份數目的約28.28%,在兩種情況下均假設超額配股權未獲行使。
募資用途方面,其中34.1%擬用於建設位於上海市嘉定區的研發中心及其他設施;14.4%用於開發現有管線產品並將其商業化;13.8%用於購買額外生產設備並替換現有生產設備及將生產線自動化;8.7%用於擴大分銷網絡及覆蓋範圍;19.6%用於為潛在戰略投資;9.4%用作一般企業用途及營運資金。
Follow us
Find us on
Facebook,
Twitter ,
Instagram, and
YouTube or frequent updates on all things investing.Have a financial topic you would like to discuss? Head over to the
uSMART Community to share your thoughts and insights about the market! Click the picture below to download and explore uSMART app!

Disclaimers
uSmart Securities Limited (“uSmart”) is based on its internal research and public third party information in preparation of this article. Although uSmart uses its best endeavours to ensure the content of this article is accurate, uSmart does not guarantee the accuracy, timeliness or completeness of the information of this article and is not responsible for any views/opinions/comments in this article. Opinions, forecasts and estimations reflect uSmart’s assessment as of the date of this article and are subject to change. uSmart has no obligation to notify you or anyone of any such changes. You must make independent analysis and judgment on any matters involved in this article. uSmart and any directors, officers, employees or agents of uSmart will not be liable for any loss or damage suffered by any person in reliance on any representation or omission in the content of this article. The content of the article is for reference only and does not constitute any offer, solicitation, recommendation, opinion or guarantee of any securities, virtual assets, financial products or instruments. Regulatory authorities may restrict the trading of virtual asset-related ETFs to only investors who meet specified requirements. Any calculations or images in the article are for illustrative purposes only.
Investment involves risks and the value and income from securities may rise or fall. Past performance is not indicative of future performance. Please carefully consider your personal risk tolerance, and consult independent professional advice if necessary.


