华能国际(600011.SH)三季报点评:业绩符合预期,股息吸引力提升
作者:王威,于鸿光
来源: EBS公用环保研究
本 • 文 • 要 • 点
◆事件:华能国际发布2019年三季报。2019年前三季度,公司营业收入1272亿元,同比增长1.0%;归母净利润53.9亿元,同比增长171%;EPS 0.32元。其中2019Q3 公司营业收入438亿元,同比增长1.2%;归母净利润15.7亿元,同比扭亏;EPS 0.10元。
◆Q3电量边际回暖,市场化比例进一步提升
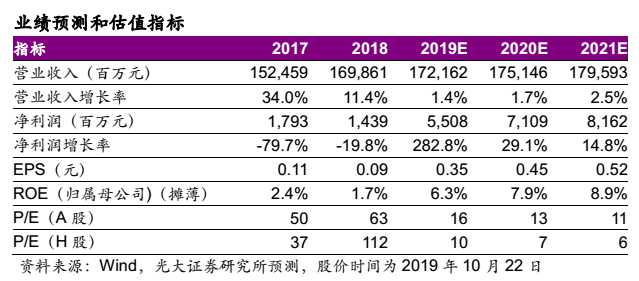
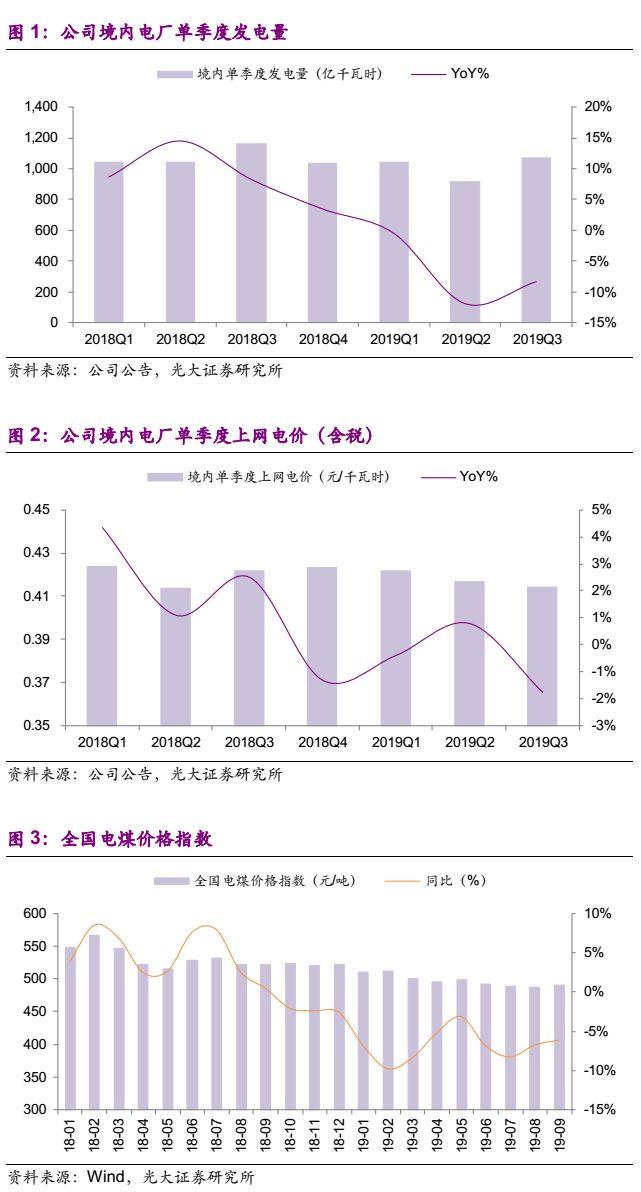
电量方面,受部分区域电力需求下滑、控煤、外来电增长等因素影响,2019年前三季度公司境内电厂发电量3022亿千瓦时,同比下滑7.5%。分季度看,2019Q3公司境内电厂发电量1068亿千瓦时,同比下滑8.3%,降幅较2019Q2收窄3.6个百分点;环比增长16.7%,增速较2018Q3提升4.5个百分点。电价方面,2019年前三季度公司境内电厂平均上网电价0.418元/千瓦时,同比小幅增长0.1%。我们测算2019Q3公司境内电厂平均上网电价约0.414元/千瓦时,同比/环比分别下滑1.8 / 0.6个百分点,我们认为主要原因为市场化交易电量比例提升。2019年前三季度,公司境内电厂市场化交易电量比例51.2%,同比提升10.9个百分点,较2019H1亦增加4.2个百分点,电力市场化比例进一步提升。我们认为,在“基准价+上下浮动”的市场化机制公布后,二级市场对于电力股2020年的盈利预期过于悲观,实际影响仍有待进一步跟踪和观察。
◆煤价下行叠加基数效应,Q3业绩持续修复
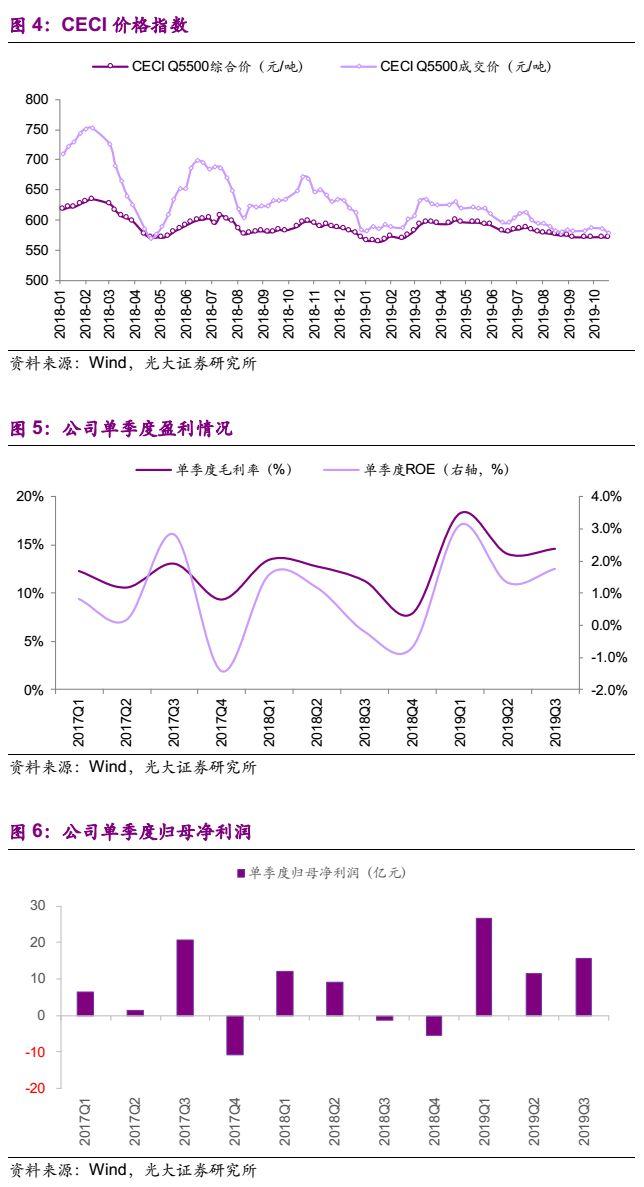
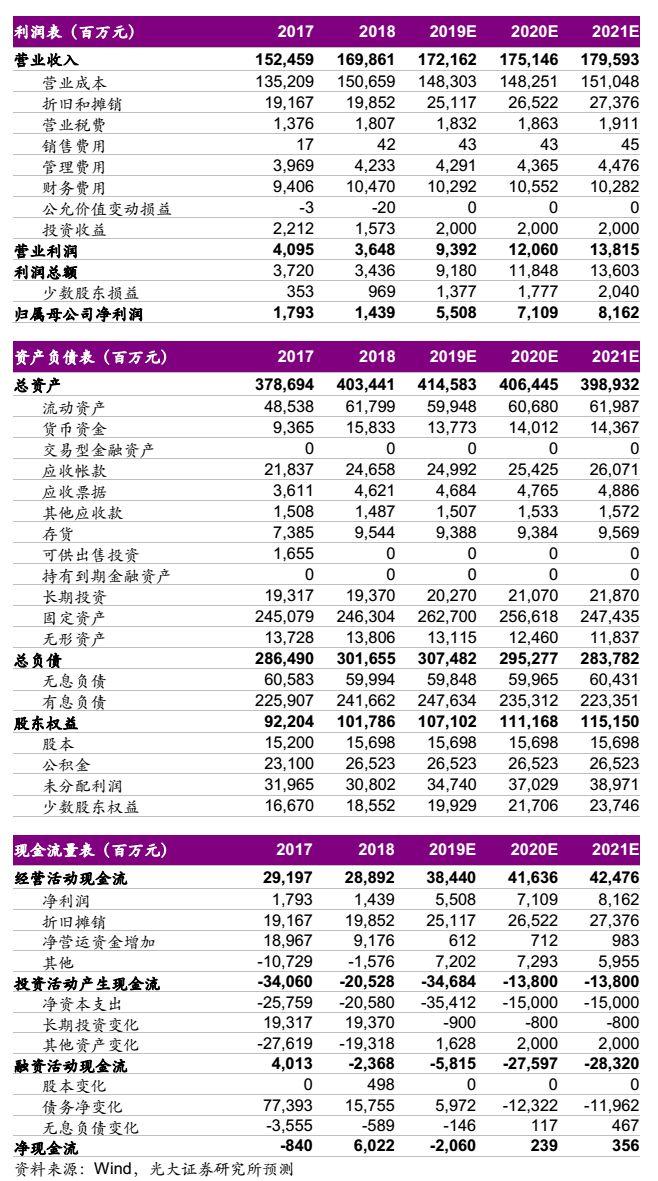
2019Q3煤炭供需关系持续改善,煤价总体处于下行区间。以全国电煤价格指数为例,2019Q3全国电煤价格指数均值约488元/吨,同比/环比下降7.1% / 1.5%。受益于成本改善,2019Q3公司毛利率14.6%,同比/环比增长3.4 / 0.5个百分点;单季度ROE 1.8%,同比由负转正(2018Q3 ROE -0.2%),环比增长0.4个百分点。考虑到成本改善,叠加去年同期的低基数效应(详见我们2018年10月的报告《三季度业绩低于预期,期待业绩弹性释放——华能国际(600011.SH)2018年三季报点评》),2019Q3公司归母净利润15.7亿元,同比扭亏(2018Q3亏损1.4亿元),环比增长34.8%。受2019Q3拉动,2019年前三季度公司归母净利润同比增长171%。
◆分红比例明确,股息吸引力提升
公司明确2018-2020年股东回报规划,在满足分红条件的前提下“每年以现金方式分配的利润原则上不少于当年实现的合并报表可分配利润的70%且每股派息不低于0.1元人民币”。我们以70%的现金分红比例测算,对应华能国际(A)、华能国际(H)2019E的股息率分别为4.3%、7.3%,股息回报可观。
◆盈利预测与投资评级
我们维持盈利预测,预计公司2019-2021年的归母净利润分别为55.1、71.1、81.6亿元,EPS分别为0.35、0.45、0.52元。当前股价对应华能国际(A)2019-2021年的PE分别为16、13、11倍,对应华能国际(H)2019-2021年的PE分别为10、7、6倍。公司作为火电龙头,盈利回升趋势确立,当前估值明显处于历史低位,重申华能国际(A)“买入”评级、华能国际(H)“买入”评级。
◆风险提示
上网电价超预期下行,动力煤价格超预期上涨,电力需求超预期下滑,汇兑损失过大,电力行业改革进度低于预期的风险等。
Follow us
Find us on
Facebook,
Twitter ,
Instagram, and
YouTube or frequent updates on all things investing.Have a financial topic you would like to discuss? Head over to the
uSMART Community to share your thoughts and insights about the market! Click the picture below to download and explore uSMART app!

Disclaimers
uSmart Securities Limited (“uSmart”) is based on its internal research and public third party information in preparation of this article. Although uSmart uses its best endeavours to ensure the content of this article is accurate, uSmart does not guarantee the accuracy, timeliness or completeness of the information of this article and is not responsible for any views/opinions/comments in this article. Opinions, forecasts and estimations reflect uSmart’s assessment as of the date of this article and are subject to change. uSmart has no obligation to notify you or anyone of any such changes. You must make independent analysis and judgment on any matters involved in this article. uSmart and any directors, officers, employees or agents of uSmart will not be liable for any loss or damage suffered by any person in reliance on any representation or omission in the content of this article. The content of the article is for reference only and does not constitute any offer, solicitation, recommendation, opinion or guarantee of any securities, virtual assets, financial products or instruments. Regulatory authorities may restrict the trading of virtual asset-related ETFs to only investors who meet specified requirements. Any calculations or images in the article are for illustrative purposes only.
Investment involves risks and the value and income from securities may rise or fall. Past performance is not indicative of future performance. Please carefully consider your personal risk tolerance, and consult independent professional advice if necessary.


