兩隻黑天鵝券商殺跌,天風證券又崩了,到底發生了什麼?
作者:小浪
來源: 公司資本論
10月22日消息,券商股暴雷,兩隻黑天鵝來襲,券商股昨日遭遇集體殺跌。今日天風證券繼續一字跌停,着實讓市場吃驚,到底發生了什麼,天風證券為何突然崩了?
兩隻黑天鵝飛來橫禍,券商股殺跌
在上週五放量大跌2.2%後,券商板塊指數21日再次低開低走,盤中一度下跌近2%,天風證券連續兩日跌停,華泰證券也暴跌7%,到底是哪裏出了錯?
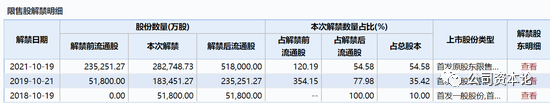
天風證券遭遇崩盤,與公司限售股解禁關係甚大。10月21日,天風證券迎來了18.3億股限售股份的解禁,解禁數量佔總股本的35.42%,以21日收盤價來統計,解禁市值為128億元。
市場人士表示,天風證券上市滿一年後小非解禁其實屬於正常情況,此前也早有公告。天風證券跌停,可能是其解禁的小非中部分是私募產品,上市流通後存在減持賣出的可能性。此外,還有配股等因素疊加,所以引發股價較大的波動。
華泰證券昨日暴跌7%,截至21日收盤,華泰證券股價報收17.19元/股,全天跌幅收窄至5.7%,總市值約1560億。
至於華泰暴跌,則是和GDR兑換機制有關。華泰證券GDR的120日鎖定期已到,並已經在10月18日放開兑回接受GDR註銷指令,兑回後的A股將於10月22日,也就是明日在A股進行流通。具體來看,本次兑回限制期屆滿的GDR數量為8251.15萬份,對應A股股票8.2515億股,佔公司總股本的9.09%。
此舉意味着什麼呢?數據顯示,10月18日,華泰證券GDR的報價為23.7美元/份,相當於16.75元/股(按最新人民幣中間價計算),與華泰證券A股10月18日收盤價18.23元/股相比,存在8.12%的價差。而GDR兑換成A股無疑對現行價格造成下行壓力。
安信證券策略分析師夏凡捷表示,由於上週收盤時華泰證券GDR價格相較A股股價存在着約8%的折價,可以預計兑回機制的啟動將在未來兩天內拉低A股股價並抬升GDR價格,並使得兩者價差趨於收斂。
天風證券又崩了,到底怎麼了?
與昨日不同的是,今天券商股集體走勢平緩,但天風證券再度崩了,到底什麼情況?
1)天風證券解禁數量巨大,股價壓力大。根據天風證券披露,本次限售股上市流通數量約為18.35億股,均為首次公開發行限售股,上市流通日期為2019年10月21日。
這説明了什麼?在解禁前,天風證券流通股本為5.18億股,流通市值為40.15億元。而在今日解禁後,天風證券流通股本增至23.53億股,按今日跌停價計算,流通市值暴增4倍至164.2億元。
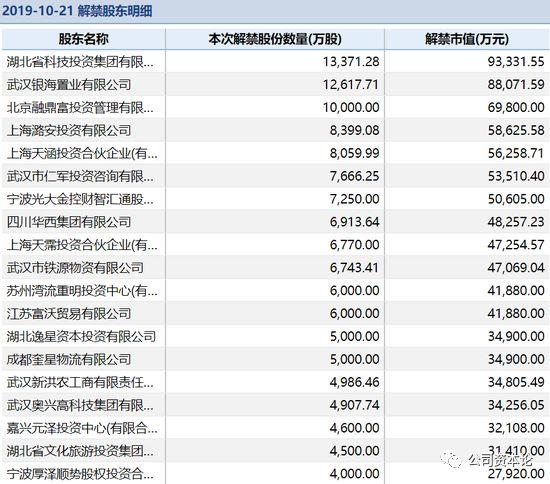
其次,公司本次解禁股東都是上市前股東,在公司股價高估的時候存在巨大套利出逃空間。天風證券本次上市流通的限售股股東數量有36名,其中武漢高科、武漢恆健通科技、湖北省科技投資集團、武漢銀海置業、西藏融鼎宸富創業投資等5家機構上市流通的數量超過1億股,36名股東合計18.3億股。
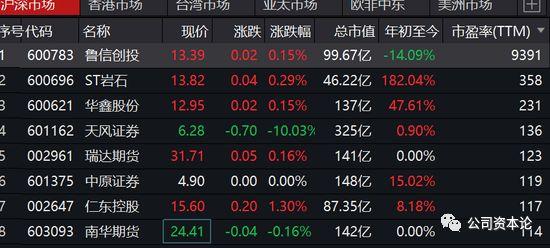
2)估值高估,或現集體拋售潮。目前,天風證券估值依然高達136倍,在券商股中雄踞第一。“天風證券跌停與限售股解禁關係緊密之外,還有在跌停情況下PB(市淨率)仍然有3倍水平,高於行業平均情況,相比之下,天風證券估值就沒有那麼便宜”,有券商分析師説道。另外,根據華金證券測算,截至2019年10月18日上市券商平均PB1.6倍,主要頭部券商PB處於1.5倍以下的歷史較低位。
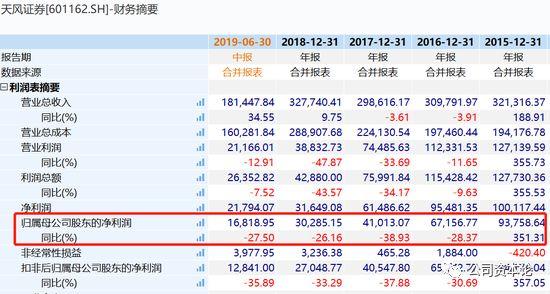
3)高估值沒有業績支撐。天風證券業績不斷下滑,近5年平均下滑30%。天風證券發佈2019年9月財務數據簡報,公司(母公司)實現營業收入2.17億元,環比增長20.64%;淨利潤3096.45萬元,環比減少7.52%。
當然,公司股價下跌,還和大的行業和市場政策有關。貨幣政策繼續收緊,通脹的出現更是降低了市場對於刺激政策的出台的預期。國慶後A股市場整體表現不夠活躍,成交量總體維持地量運行,這進一步壓縮了券商業績的彈性,進而壓制了券商股股價的表現。
科創板的整體上市速度不及預期。科創板7月剛正式交易的時候,市場大部分券商預測到11月科創板將有50家企業上市,到年底將有100家公司上市。可截至今日,科創板僅有34家公司上市交易,與預期相差甚遠,3個月來,平均每月僅3家公司上市。
Follow us
Find us on
Facebook,
Twitter ,
Instagram, and
YouTube or frequent updates on all things investing.Have a financial topic you would like to discuss? Head over to the
uSMART Community to share your thoughts and insights about the market! Click the picture below to download and explore uSMART app!

Disclaimers
uSmart Securities Limited (“uSmart”) is based on its internal research and public third party information in preparation of this article. Although uSmart uses its best endeavours to ensure the content of this article is accurate, uSmart does not guarantee the accuracy, timeliness or completeness of the information of this article and is not responsible for any views/opinions/comments in this article. Opinions, forecasts and estimations reflect uSmart’s assessment as of the date of this article and are subject to change. uSmart has no obligation to notify you or anyone of any such changes. You must make independent analysis and judgment on any matters involved in this article. uSmart and any directors, officers, employees or agents of uSmart will not be liable for any loss or damage suffered by any person in reliance on any representation or omission in the content of this article. The content of the article is for reference only and does not constitute any offer, solicitation, recommendation, opinion or guarantee of any securities, virtual assets, financial products or instruments. Regulatory authorities may restrict the trading of virtual asset-related ETFs to only investors who meet specified requirements. Any calculations or images in the article are for illustrative purposes only.
Investment involves risks and the value and income from securities may rise or fall. Past performance is not indicative of future performance. Please carefully consider your personal risk tolerance, and consult independent professional advice if necessary.


