南京銀行(601009.SH)1H19業績點評:盈利能力強勁,資產質量穩定,期待定增推進
作者:申萬宏源銀行組
來源:大金融研究
本期投資提示
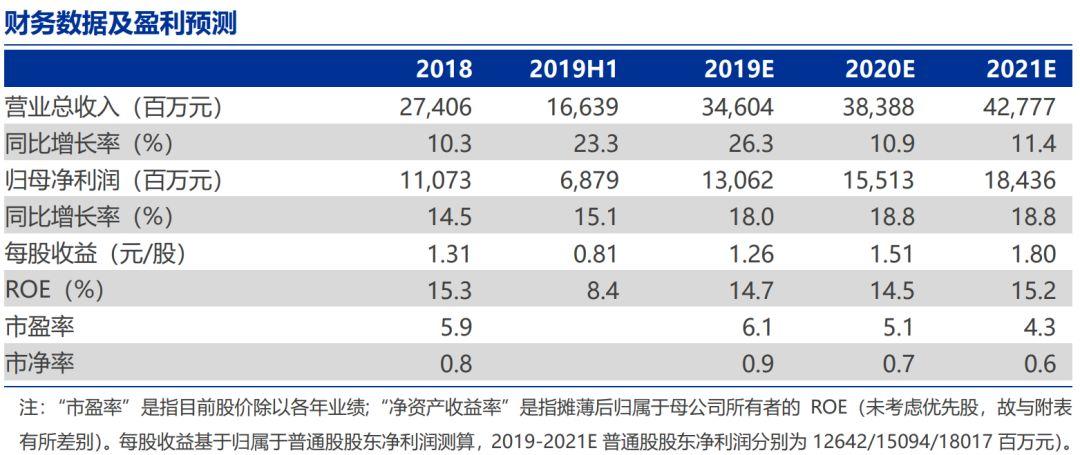
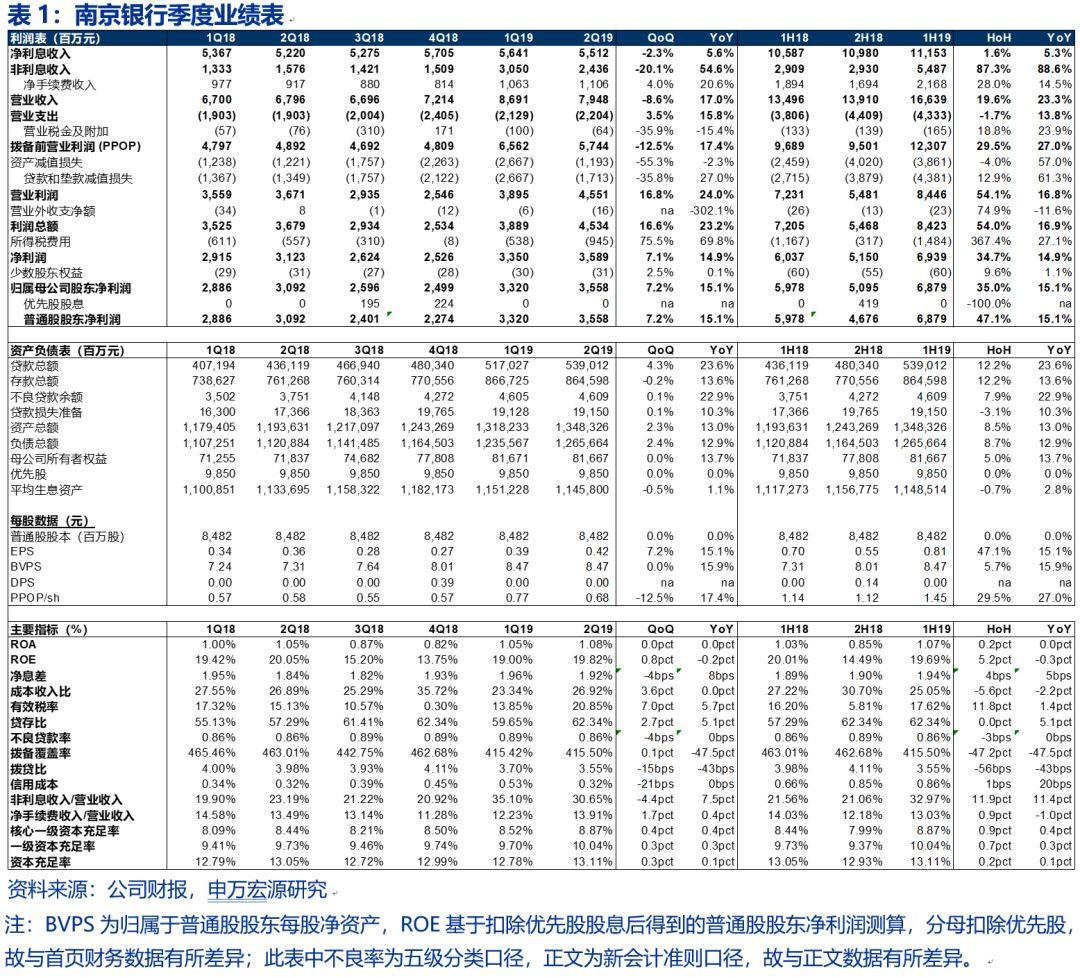
事件:南京銀行披露2019年中報,1H19實現營業收入166億元,同比增長23.3%;實現歸母淨利潤69億元,同比增長15.1%,符合預期。2Q19不良率季度環比持平於0.89%(監管口徑),撥備覆蓋率季度環比提升0.1個百分點至415.5%。
資產業績增速保持15%以上、營收維持20%以上的高速增長,盈利能力上市銀行第一梯隊。1H19南京銀行營收、PPOP、歸母淨利潤同比增速分別為23.3%、27.0%和15.1%,預計仍將保持在上市銀行前列。營收端,淨利息收入同比增速保持相對穩定,而手續費淨收入同比增速則提升至雙位數水平。1H19南京銀行手續費淨收入同比增速為14.5%,較1Q19的8.8%明顯修復,結構上看零售與對公手續費表現各有千秋,銀行卡(36%)、代理及諮詢(18%)手續費增速較快,債券承銷手續費亦增長6%,佔總手續費收入的28%。
資產調結構、同業負債降成本助力南京銀行1H19淨息差提升。1H19淨息差環比2H18提高5bps至1.94%,根據息差環比變動分析,資產端結構因素和負債端利率因素是兩大助攻。1)資產端,南京銀行提高高收益率資產貸款的比重、提高零售貸款佔比。2Q19貸款同比增長23.6%,佔總資產比重創歷史新高突破40%。1H19新增貸款587億元,佔1H19新增總資產比重為56%。投放結構上零售於對公(含票據貼現)各佔一半,而對公貸款則以一般性貸款為主、大力壓降票據貼現,截止1H19零售貸款佔比已經達到歷史最高值29.1%。資產端調結構的同時,貸款定價上行有效抵消了金融市場資產利率的下降,1H19生息資產收益率環比提高9bps至4.85%,其中1H19貸款收益率環比2H18提升18bps至5.81%,對公和零售貸款分別環比2H18提高6和46bps至5.43%和6.76%。2)受益於當前“資產緊-負債鬆”的格局,1H19同業負債、應付債券利率明顯下行,環比2H18下降35和52bps至2.54%和3.77%。我們亦發現,與其他披露中報的銀行類似,1H19南京銀行存款成本上行幅度明顯收窄,其中對公定期存款成本環比2H18下降2bps至3.20%。由於南京銀行日均存款中69%來自對公定期,因此我們預計下半年淨息差負債端存款利率因素的負面貢獻將進一步減少,緩解負債成本穩定息差。
不良率低位穩定,撥備水平環比微升。南京銀行不良率已連續三個季度持平於0.89%,剔除年初切換IFRS9的影響,1H19加回核銷不良生成率環比2H18提升23bps至111bps,不良生成略有提升。潛在不良壓力上,逾期略有上行,1H19 關注率環比年初下降11bps至1.31%,但逾期率環比年初上升9bps至1.41%。但不良認定標準並未鬆懈,1H19逾期90天以上貸款/不良環比年初提高1.7個百分點至95.7%。從撥備水平來看,年初受切換準則IFRS9影響使得表內撥備減少而大幅增提表外撥備,導致1Q19撥備覆蓋率出現顯著降幅,但2Q19已實現環比微升,撥備覆蓋率小幅提升至415.5%。我們認為,南京銀行撥備水平本就充足,在原25家上市銀行中僅次於寧波銀行和常熟銀行,基於穩健審慎的原則,預計未來撥備基礎仍將有所增厚。
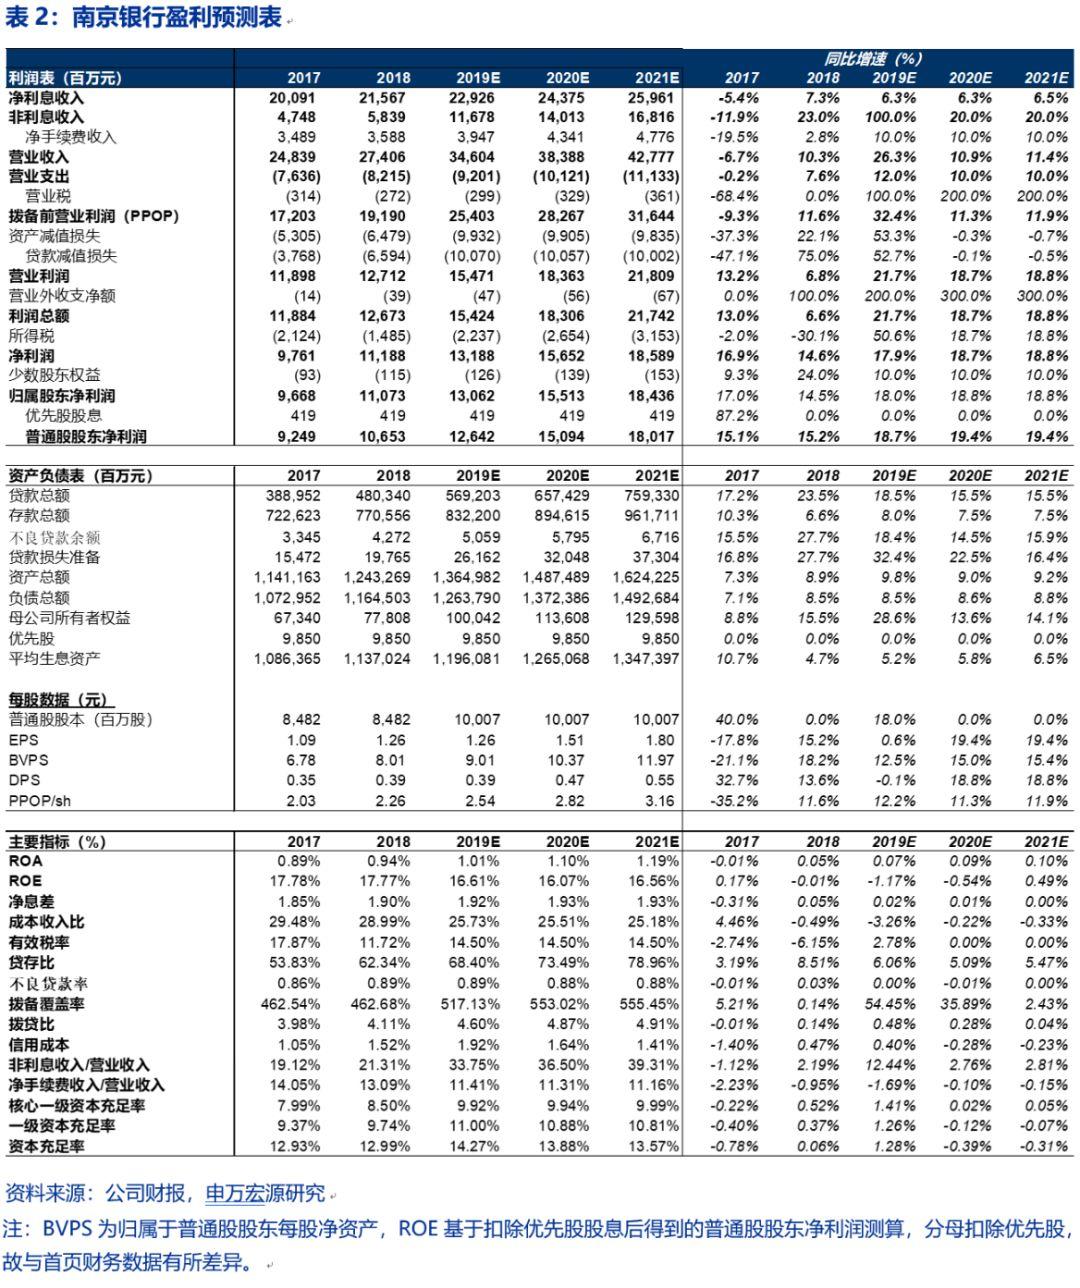
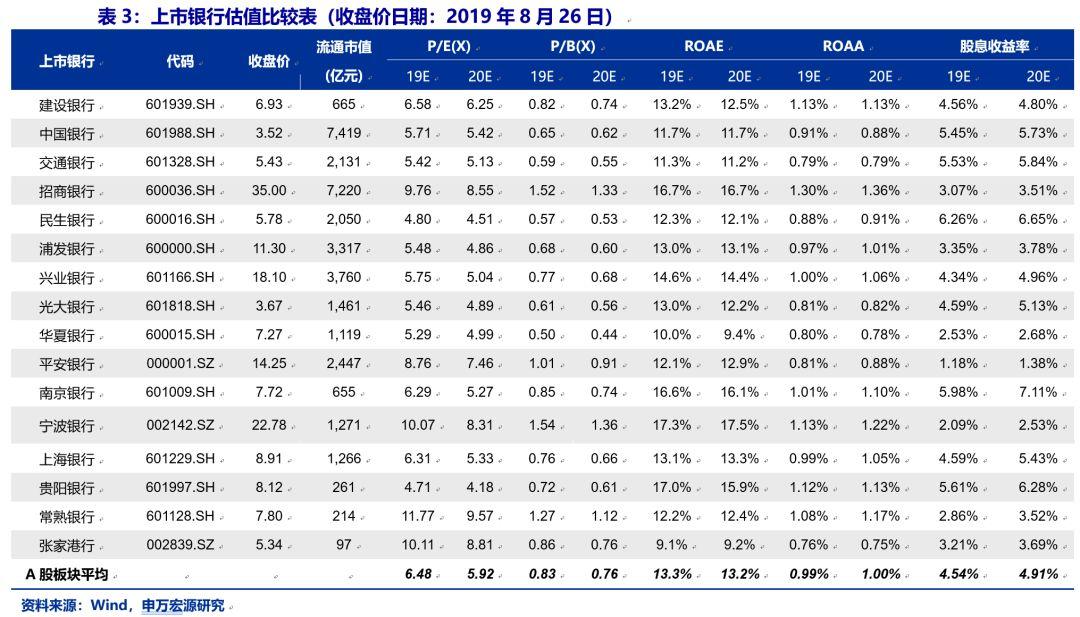
公司觀點:南京銀行基本面穩居第一梯隊,營收高增,息差、不良企穩,估值破淨而維持高股息,投資性價比突出。新定增方案8月20日股東大會通過,期待後續進一步進展,未來定增落地將有力夯實南京銀行資本實力、在業務協同上提供更為豐富的資源。預計2019-2021年歸母淨利潤增速為18.0%、18.8%、18.8%(維持盈利預測),當前股價對應19年僅0.85X PB,較寧波銀行折價45%,19年目標估值1.2X PB,對應41%上行空間,維持買入評級和A股首推組合。
風險提示:經濟大幅下滑引發不良風險。
Follow us
Find us on
Facebook,
Twitter ,
Instagram, and
YouTube or frequent updates on all things investing.Have a financial topic you would like to discuss? Head over to the
uSMART Community to share your thoughts and insights about the market! Click the picture below to download and explore uSMART app!

Disclaimers
uSmart Securities Limited (“uSmart”) is based on its internal research and public third party information in preparation of this article. Although uSmart uses its best endeavours to ensure the content of this article is accurate, uSmart does not guarantee the accuracy, timeliness or completeness of the information of this article and is not responsible for any views/opinions/comments in this article. Opinions, forecasts and estimations reflect uSmart’s assessment as of the date of this article and are subject to change. uSmart has no obligation to notify you or anyone of any such changes. You must make independent analysis and judgment on any matters involved in this article. uSmart and any directors, officers, employees or agents of uSmart will not be liable for any loss or damage suffered by any person in reliance on any representation or omission in the content of this article. The content of the article is for reference only and does not constitute any offer, solicitation, recommendation, opinion or guarantee of any securities, virtual assets, financial products or instruments. Regulatory authorities may restrict the trading of virtual asset-related ETFs to only investors who meet specified requirements. Any calculations or images in the article are for illustrative purposes only.
Investment involves risks and the value and income from securities may rise or fall. Past performance is not indicative of future performance. Please carefully consider your personal risk tolerance, and consult independent professional advice if necessary.


