


作者:草叔
來源:草叔消費升級研究
業績簡評
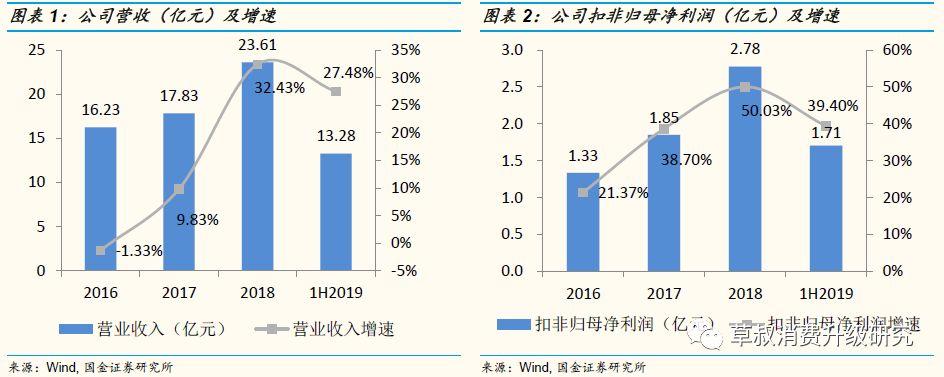
1H 2019公司實現營收13.28億元,同比+27.48%;
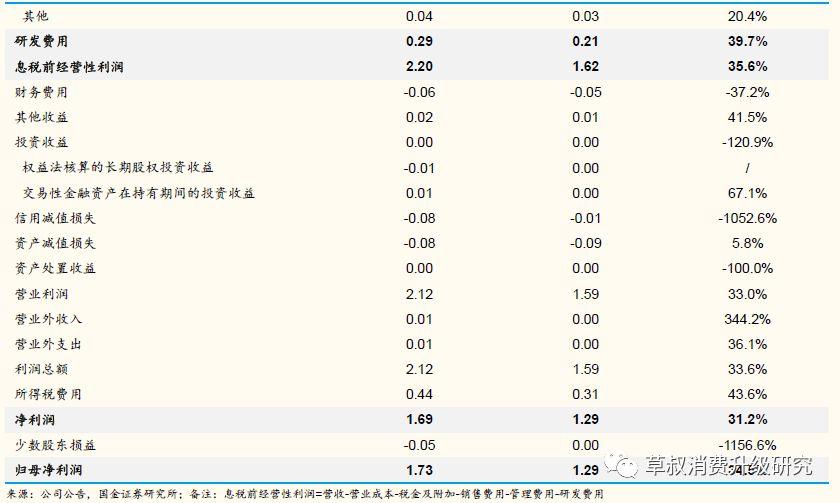
歸母淨利潤1.73億元,同比+34.49%;
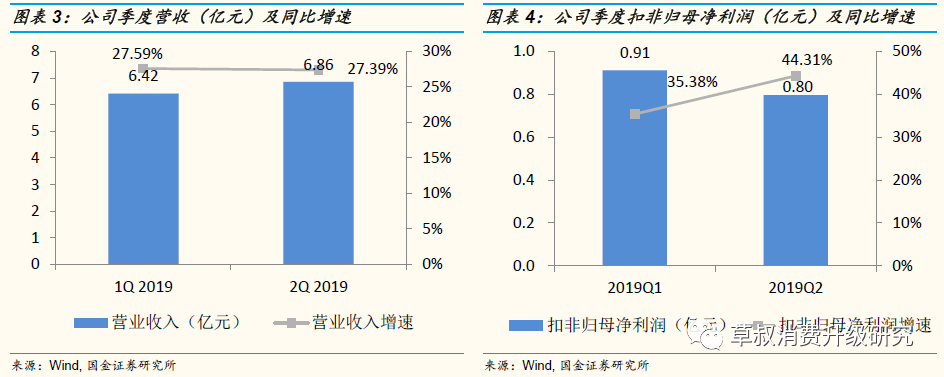
扣非歸母淨利潤1.71億元,同比+39.40%。
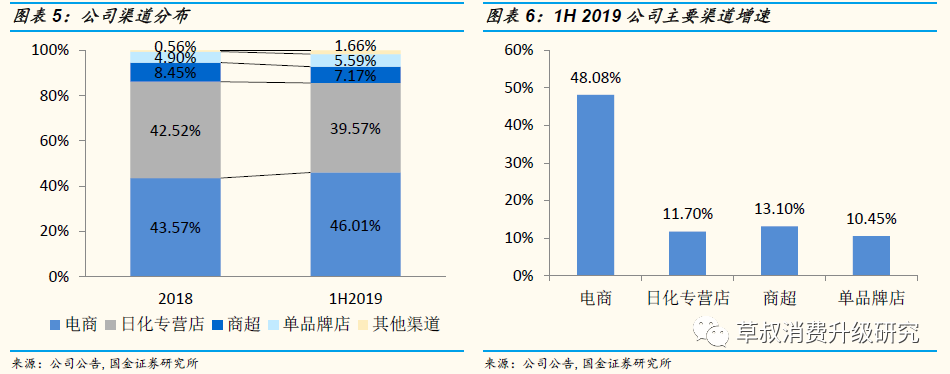
其中,Q2單季公司實現營收6.86億元,同比+27.39%,增速較Q1環比-0.20pct;
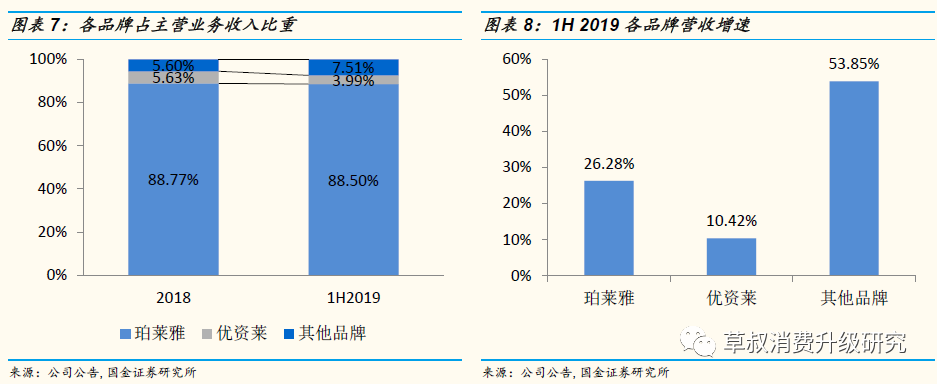
Q2實現歸母淨利潤0.82億元,同比+39.39%;
扣非歸母淨利潤為0.80億元,同比+44.31%,增速較Q1環比+8.93pct。
經營分析
電商渠道表現強勢,線下渠道穩健增長:1H19公司電商渠道營收6.11億元,佔比46.01%,同比+48.08%,其中電商直營佔比47.30%,電商經銷佔比52.70%;CS渠道營收5.25億元,佔比39.57%,同比+11.70%;商超營收0.95億元,佔比7.17%,同比+13.10%;單品牌店營收0.74億元,佔比5.59%,同比+10.45%。;其他渠道營收0.22億元,佔比1.66%。
品牌升級&新品上市,主品牌快速增長:1H19主品牌珀萊雅營收11.74億元,佔比88.50%,同比+26.28%。2019年上半年基於品牌“海洋”的DNA,推出4大新品系列:精華家族,包括煙酰胺美白精華以及膠原蛋白線雕精華;深海保濕酵母原液;極境專效修護面膜;印彩巴哈insbaha彩粧粉底液和眼影盤。優資萊品牌實現營收0.53億元,佔比3.99%,同比+10.42%。其他品牌營收1億元,佔比7.51%,同比+53.85%。
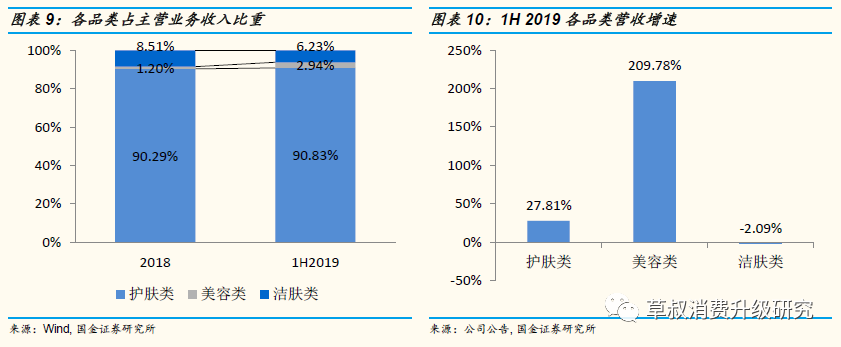
護膚品類根基穩健,彩粧新品類增長迅猛:1H19護膚類營收12.05億元,佔比90.83%,同比+27.81%;美容(彩粧)營收0.39億元,佔比2.94%,同比+209.78%;潔膚營收0.83億元,佔比6.23%,同比-2.09%。
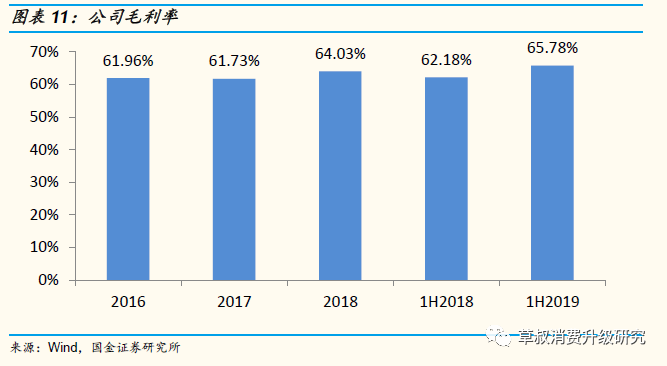
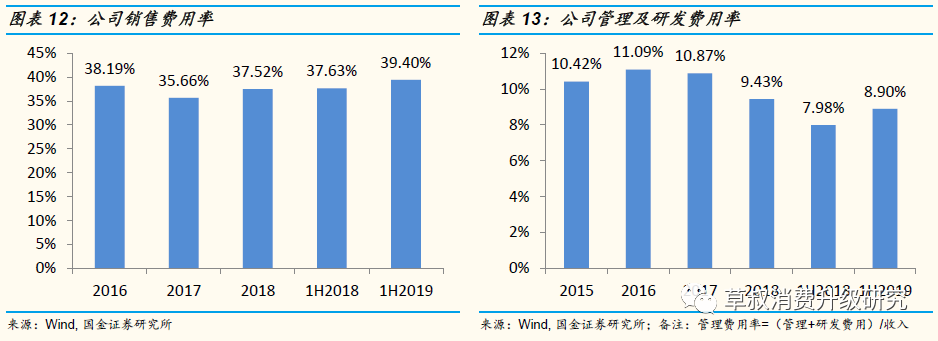
19H1綜合毛利率同比+3.6pct, 銷售費用率同比+1.77pct,淨利率同比+0.68pct:1H19毛利率為65.78%,毛利率提升的主要原因為電商渠道佔比提升,且電商渠道中的直營電商佔比提升;化粧水、精華類等高毛利產品佔比提升。銷售費用率為39.40%,提升原因為配合新品推廣和爆品打造,加大廣告投入。管理費用率(含研發費用)為8.90%,同比+0.92pct,公司毛利率提升幅度大於費用率端,歸母淨利率同比+0.68pct至13.06%。
1.1H 2019扣非淨利潤同比+39%,電商及主品牌表現靚麗
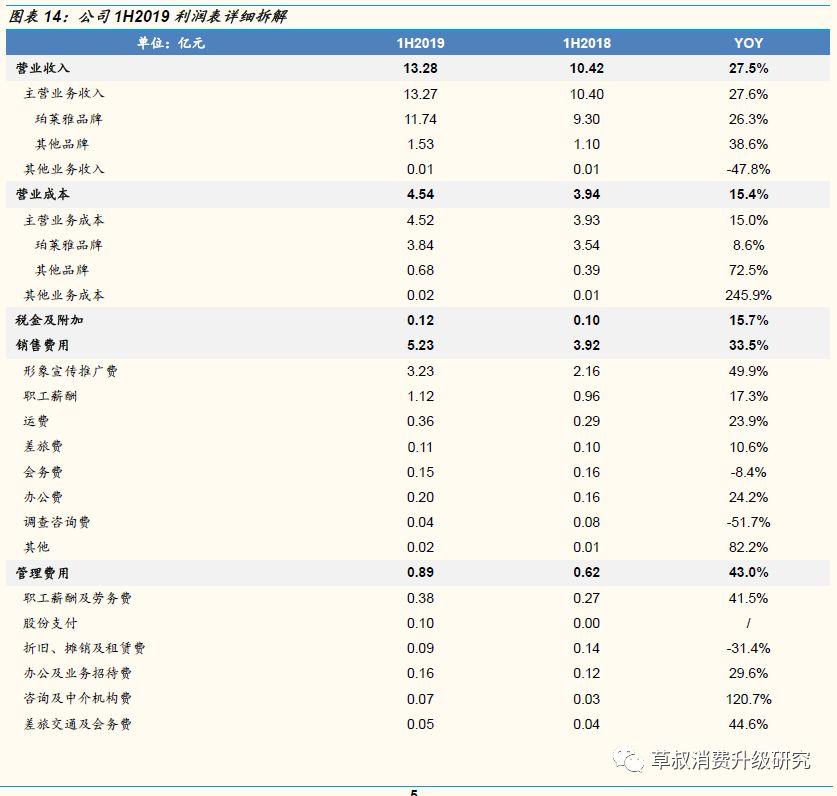
1H 2019公司實現營收13.28億元,同比+27.48%;歸母淨利潤1.73億元,同比+34.49%;扣非歸母淨利潤1.71億元,同比+39.40%。其中,Q2單季公司實現營收6.86億元,同比+27.39%,增速較Q1環比-0.20pct;Q2實現歸母淨利潤0.82億元,同比+39.39%;扣非歸母淨利潤為0.80億元,同比+44.31%,增速較Q1環比+8.93pct。
電商渠道表現強勢,線下渠道穩健增長:1H 2019公司電商渠道營收6.11億元,佔比46.01%,同比+48.08%,其中電商直營佔比47.30%,電商經銷佔比52.70%;CS渠道營收5.25億元,佔比39.57%,同比+11.70%;商超營收0.95億元,佔比7.17%,同比+13.10%;單品牌店營收0.74億元,佔比5.59%,同比+10.45%。;其他渠道營收0.22億元,佔比1.66%。
品牌升級&新品上市,主品牌快速增長:1H 2019主品牌珀萊雅實現營收11.74億元,佔比88.50%,同比+26.28%。2019年上半年基於品牌“海洋”的DNA,推出4大新品系列:精華家族,包括煙酰胺美白精華以及膠原蛋白線雕精華;深海保濕酵母原液;極境專效修護面膜;印彩巴哈insbaha彩粧粉底液和眼影盤。優資萊品牌實現營收0.53億元,佔比3.99%,同比+10.42%。其他品牌營收1億元,佔比7.51%,同比+53.85%。
護膚品類根基穩健,彩粧新品類增長迅猛:1H 2019護膚類營收12.05億元,佔比90.83%,同比+27.81%;美容(彩粧)類營收0.39億元,佔比2.94%,同比+209.78%;潔膚類營收0.83億元,佔比6.23%,同比-2.09%。
2.綜合毛利率同比+3.6pct,提升幅度大於費用率端,拉動歸母淨利率同比+0.68pct
1H2019公司綜合毛利率同比+3.6pct:1H2019公司綜合毛利率為65.78%,同比+3.6pct。毛利率提升的主要原因為①渠道結構變化:電商渠道佔比提升,且電商渠道中的直營電商佔比進一步提升;②產品結構變化:化粧水、精華類等高毛利產品佔比提升。
從費用端來看:1H2019銷售費用率為39.40%,同比+1.77pct,主要原因為2019年上半年為配合公司新品推廣和爆品打造。管理費用率(含研發費用)為8.90%,同比+0.92pct,主要與股權激勵費用、管理職工薪酬和研發投入增加有關。整體來看,公司毛利率提升幅度大於費用率端,歸母淨利率同比+0.68pct至13.06%。
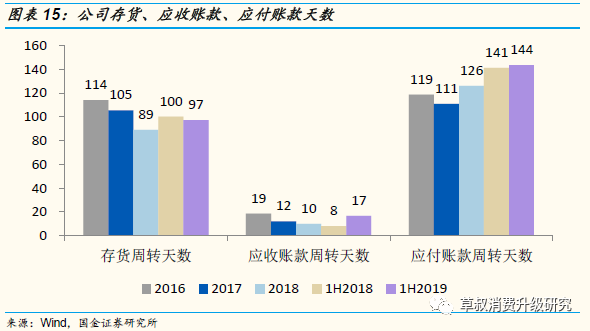
受應收賬款週轉天數增加影響,1H2019淨營業週期較去年同期有所增加:1H2019公司的存貨週轉天數為97天,較1H2018減少3天;應收賬款週轉天數為17天,較1H2018增加9天;應付賬款週轉天數為144天,較1H2018增加3天,整體淨營業週期增加3天。
公司以往的特點是主品牌突出、護膚品類突出、CS渠道突出,19年開始將由單一化過渡為生態化。期待公司形成品牌矩陣、品類矩陣、渠道矩陣,以抓住不同的增長契機。
多品牌:差異化的多品牌發展,形成品牌矩陣,提高抗風險能力,建立不同消費需求增長,同時考慮併購等形式實現外延式增長。
多品類:向護膚、彩粧、洗護、功能護膚、男士護膚、嬰幼兒護膚等全品類發展,形成品類矩陣,並主攻高速成長品類。
多渠道:覆蓋日化專營店、商場、超市、單品牌店、電子商務等多渠道銷售網絡,形成渠道矩陣,以抓住渠道變革增長契機。
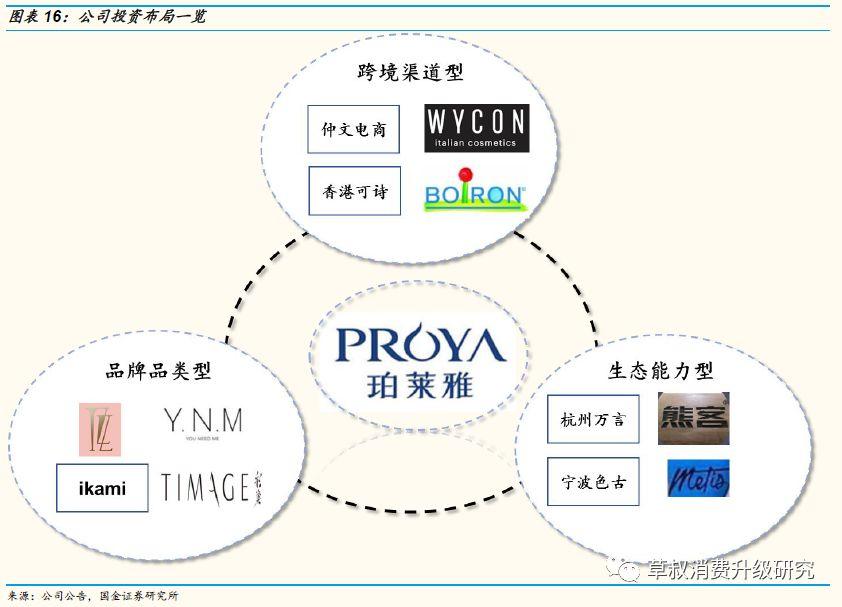
展望未來,公司有望通過內部孵化+外部參股控股投資模式,打造大美業生態:目前公司已投資佈局的公司包括①品牌品類型如TZZ、YNM、ikami、TIMAGE等,②跨境渠道型如仲文電商、香港可詩、WYCON、BOIRON等,③生態能力型如杭州萬言、寧波色谷、熊客等。生態化戰略佈局有望助力公司長期持續分享國內美粧個護行業的增長紅利。
投資建議:
展望2019,公司多品牌+多品類+多渠道的矩陣佈局值得期待。
2019-2021年預測公司EPS分別為1.92、2.41、2.85元,同比+34.81%、+25.29%、18.25%,當前市值對應PE分別為40、32、27倍,維持買入評級。
風險提示:
新品牌或品類發展不及預期、市場競爭加劇、消費增速放緩、渠道結構變革


More Content


