


来源:Choice数据 东方财富网
截至2019年8月31日,除了*ST长生无法在法定期限内披露半年报之外,沪深两市3679家上市公司披露了2019半年度财务报告。
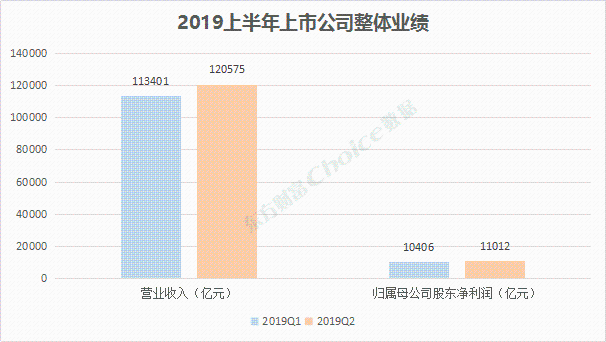
总体来看,2019上半年所有A股公司合计实现营业总收入235072.79亿元,其中第二季度营收120575.33亿元,环比上升6.32%;合计归属母公司股东净利润21420.70亿元,其中第二季度实现净利润11012.11亿元,环比增长5.82%。
数据来源:东方财富Choice数据
2019上半年业绩总览
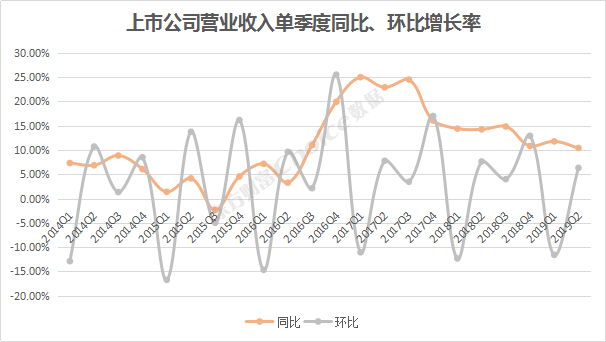
从单季度可比数据来看,上市公司营业收入增速放缓,近3个季度同比增速均处在10%左右(2018Q4:+10.83%、2019Q1:+11.78%、2019Q2:+10.41%),环比方面增幅为6.33%。
数据来源:东方财富Choice数据
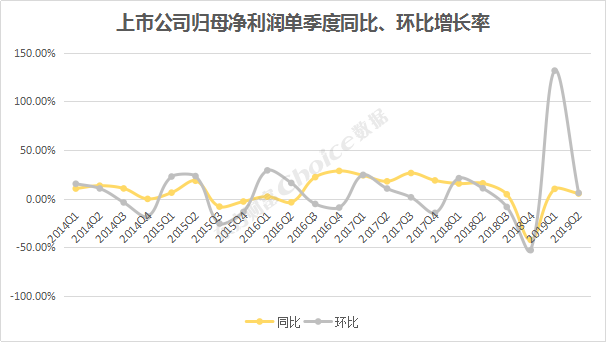
归母净利润方面,今年企业业绩单季度同比增速放缓,环比增速大幅下滑。2019年一季度和二季度净利润同比、环比增幅分别为5.23%和5.82%。
数据来源:东方财富Choice数据
而在剔除金融、两油之后,上市公司2019上半年营业收入合计163999.58亿元,同比增幅9.19%;归母净利润合计9419.95亿元,同比下降0.46%,两者表现均低于整体增速水平。
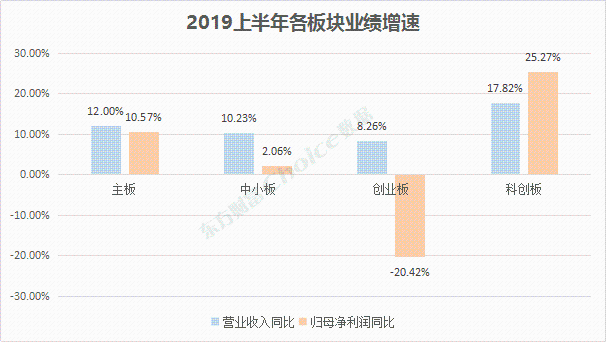
各板块分布显示,主板、中小板、创业板和科创板2019上半年分别实现营业收入203290.23、22831.47、6719.08亿元和329.63亿元,较去年同期增长12%、10.23%、8.26%和17.82%。
各板块合计归属于母公司净利润分别为19601.33、1640.68、257.45和45.6亿元,主板、中小板和科创板同比增长10.57%、2.06%和25.27%,而创业板净利润同比下降20.42%。
主板公司业绩表现平稳,科创板营收和净利增长可观,中小板公司业绩初露疲态,创业板业绩表现不佳。
数据来源:东方财富Choice数据
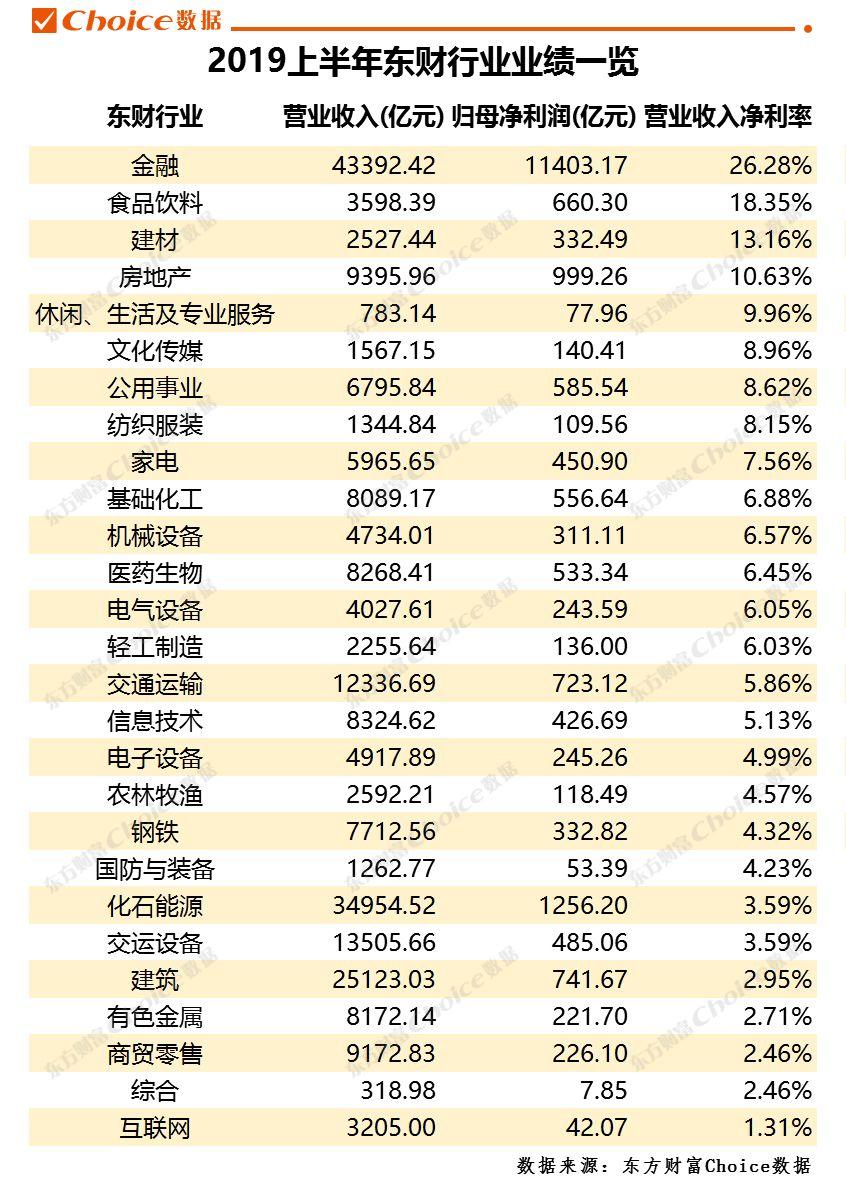
各行业的业绩表现来看,金融、化石能源、建筑、交运设备和交通运输等传统行业依然是营收大户,半年度收入均超过1万亿元;上述行业除了交运设备以外,归属于母公司股东净利润均超过700亿元。而休闲服务、国防和综合、互联网和综合4个行业净利润不及100亿元。
净利率方面,金融、食品饮料、建材和房地产行业相对较高,超过10%。
数据来源:东方财富Choice数据
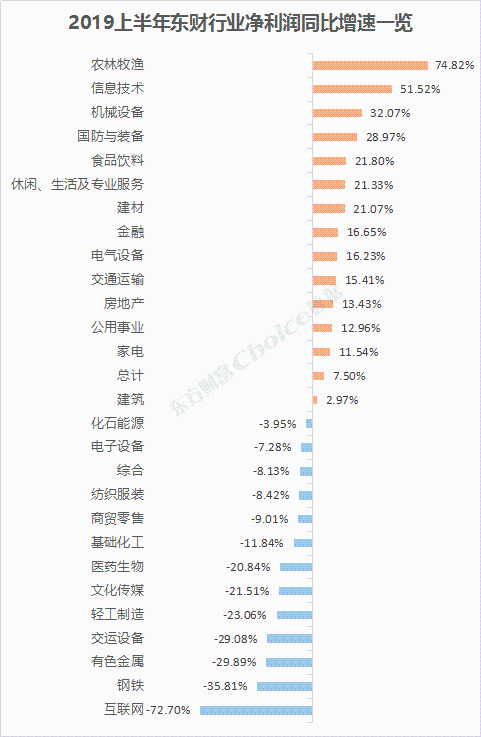
同比方面,总计27个东财行业中,仅有15个实现半年度归属于母公司净利润同比正增长,其中农林牧渔行业涨幅最高,达74.83%,信息技术行业51.52%排名第二;机械设备、国防装备和食品饮料涨幅居前。13个行业净利润同比下滑明显,互联网、钢铁、有色金属和交运设备跌幅较大。
数据来源:东方财富Choice数据
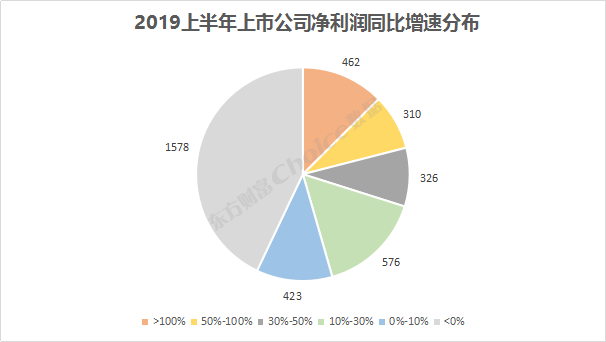
上市公司业绩同比情况显示,2097家公司今年上半年净利润实现正增长,1578家增长为负。
具体来看,462家净利润增幅翻番;310家净利润增长50%至100%之间;326家增幅30%至50%之间;576家增幅10%至30%之间;423家净利润增速低于一成。
数据来源:东方财富Choice数据
2019上市公司中报排行榜
纵观全市场中报业绩表现后,再来看看上市公司各榜单排名。
1
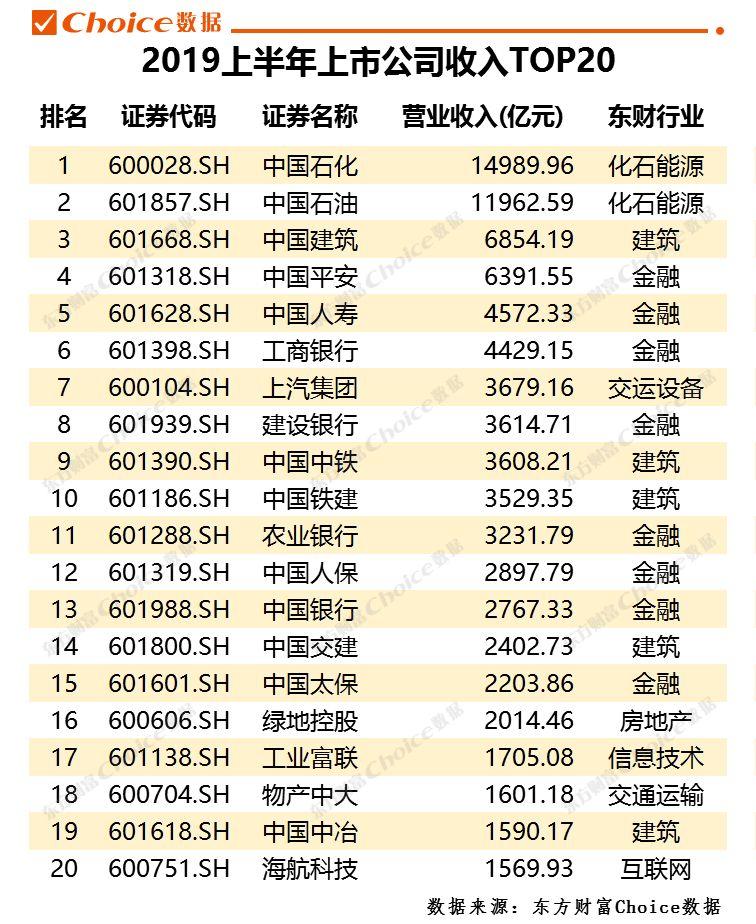
2019半年度收入榜
上市公司营业收入方面,两桶油占据前两位,中国石化收入达到约1.5万亿元。金融及建筑行业公司上榜居多,另外上汽集团、绿地控股、工业富联、物产中大和海航科技也排名靠前。
数据来源:东方财富Choice数据
2
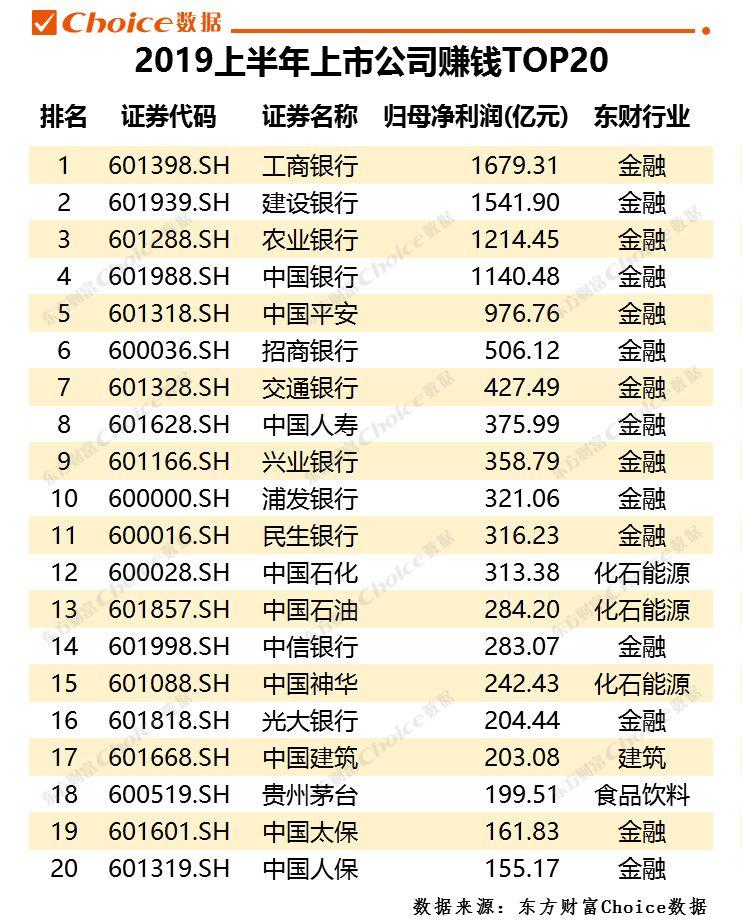
2019半年度赚钱榜
归属于母公司净利润方面,全部A股中金融及能源上市公司上榜较多,工商银行、建设银行、农业银行和中国银行上半年赚钱超过1000亿元。
数据来源:东方财富Choice数据
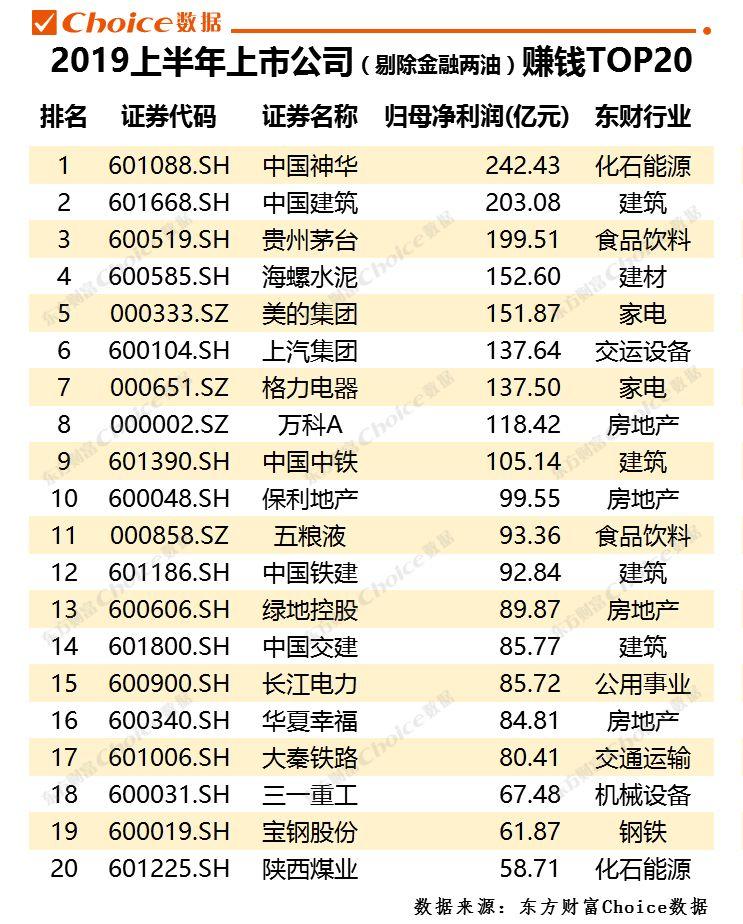
在剔除两油和金融行业公司后,中国神华、中国建筑和贵州茅台位居净利润榜前三位,另外如海螺水泥、美的集团、上汽集团、格力电器和万科A等龙头上市公司也进入榜单。
数据来源:东方财富Choice数据
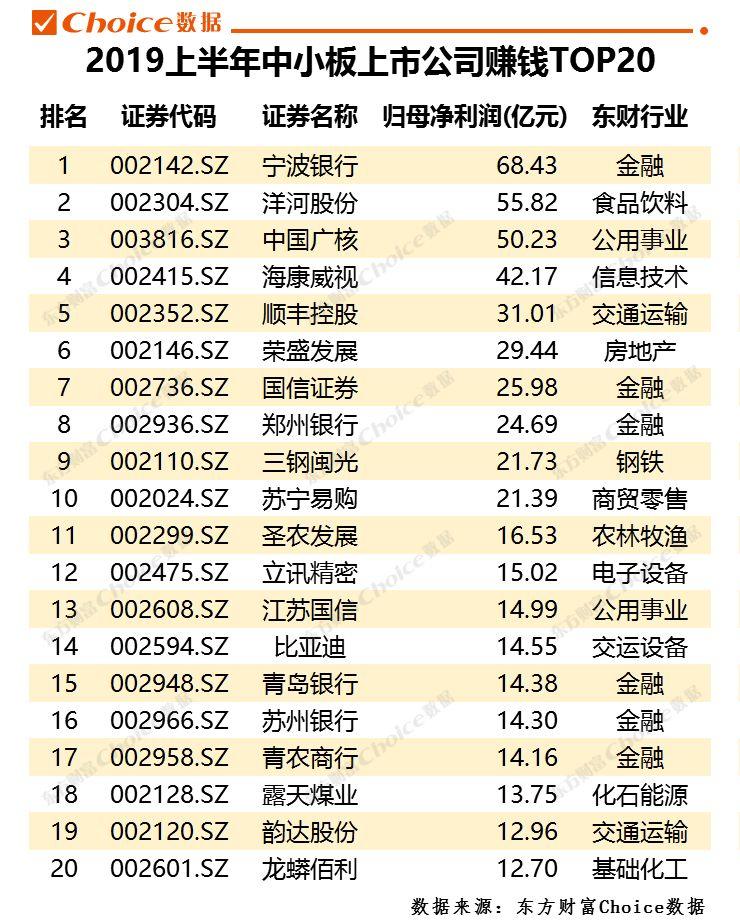
中小板方面,宁波银行、洋河股份和中国广核分列赚钱榜前三位。
数据来源:东方财富Choice数据
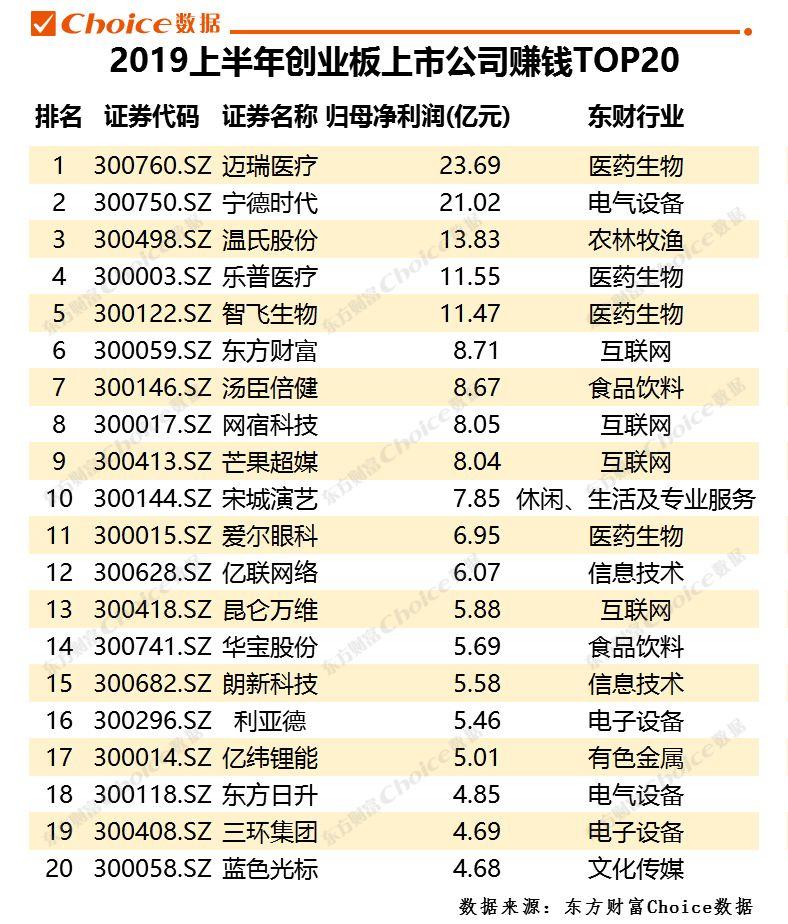
创业板方面,迈瑞医疗独占鳌头,宁德时代赚钱能力紧随其后,温氏股份、乐普医疗和智飞生物上半年归属于母公司净利润均超过10亿。
数据来源:东方财富Choice数据
3
2019半年度亏钱榜
净亏损榜单中,ST信威和乐视网亏损过百亿。ST华业和长安汽车亏损超过20亿元。
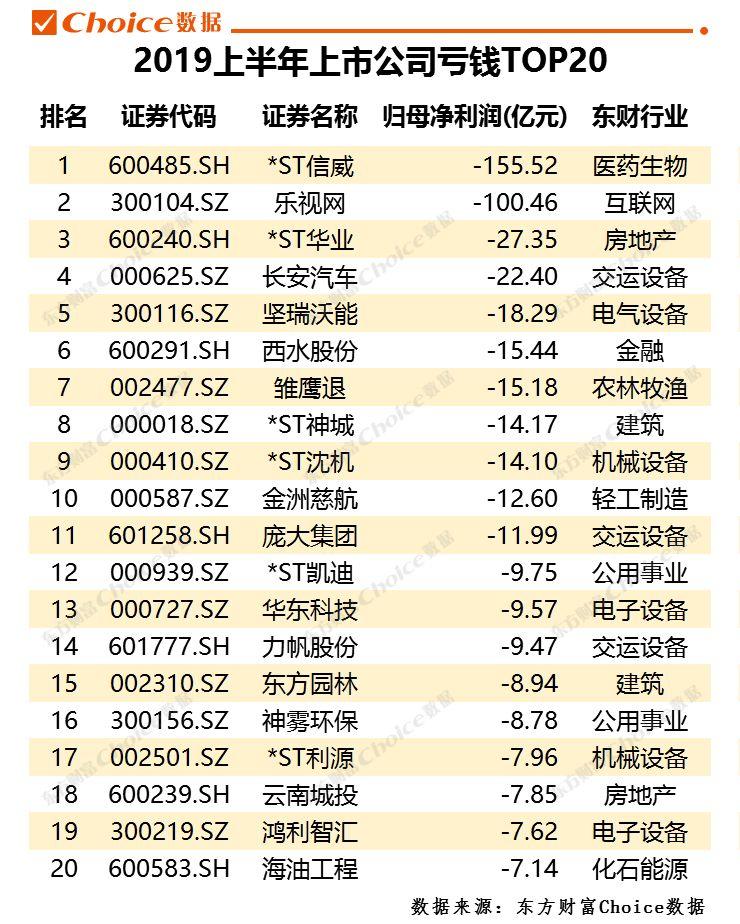
数据来源:东方财富Choice数据
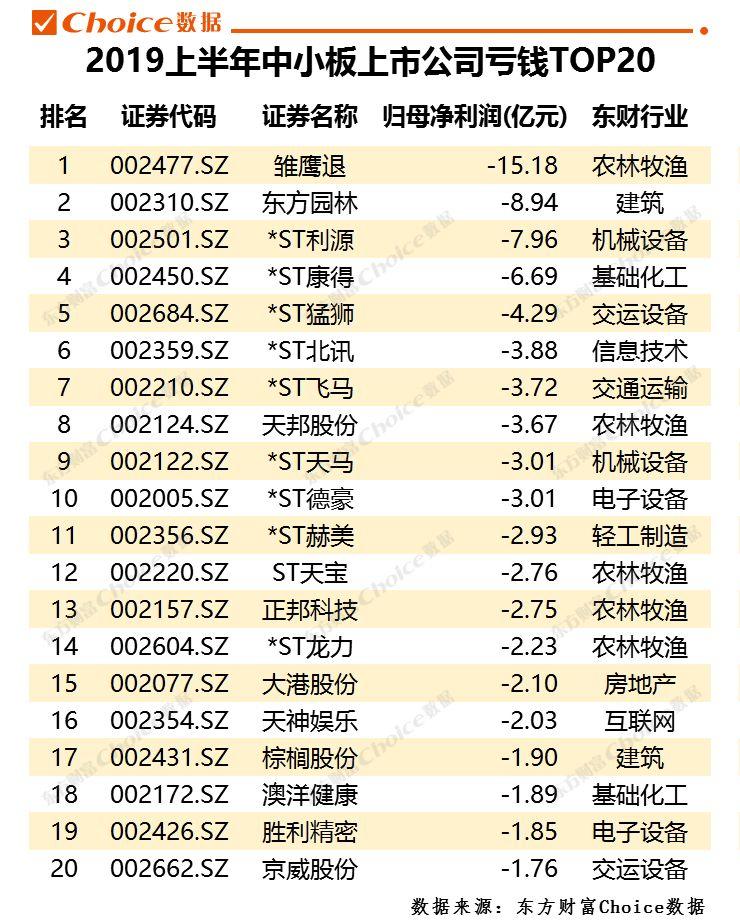
中小板方面,亏损排名居前的一半为ST股票,雏鹰退、东方园林亏损较大。
数据来源:东方财富Choice数据
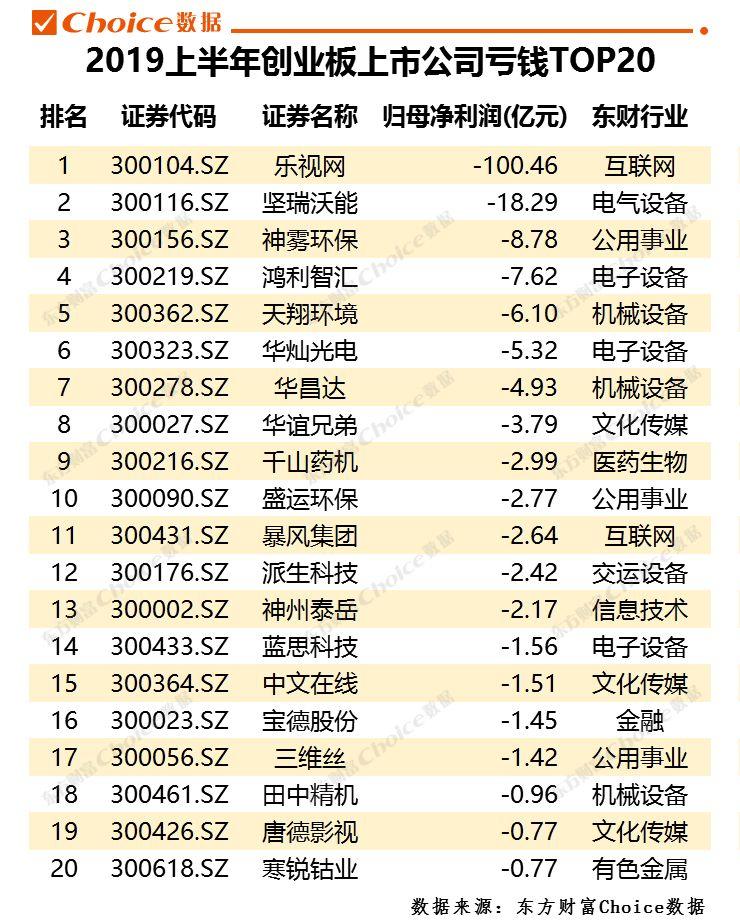
创业板方面,乐视网上半年亏损达到100.46亿元。另外,坚瑞沃能、神雾环保、鸿利智汇和天翔环境也有较为显著的经营亏损情况。
数据来源:东方财富Choice数据
4
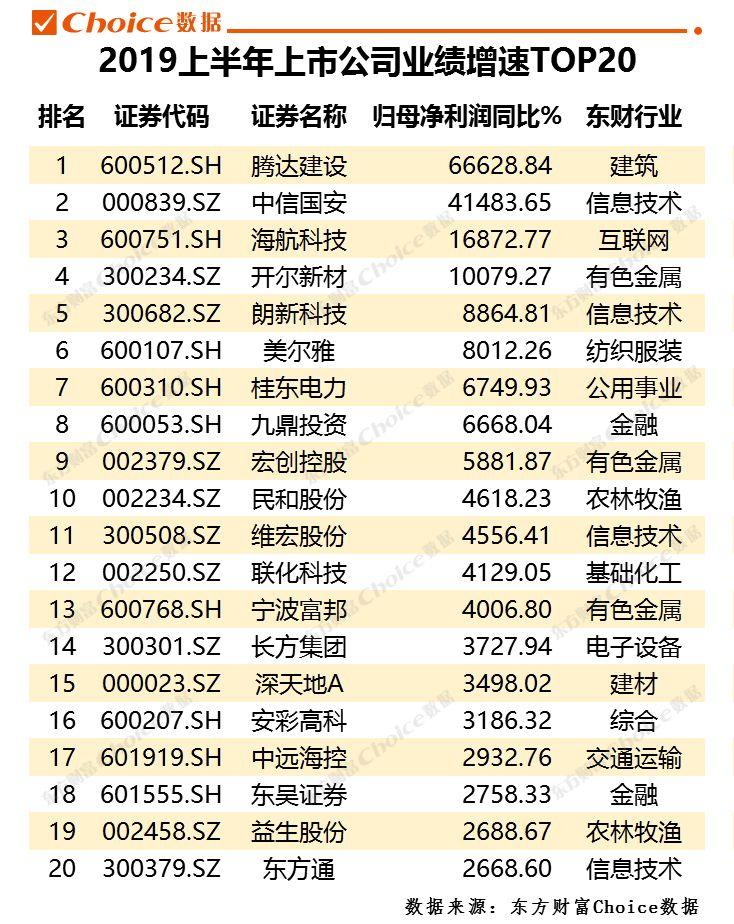
2019半年度业绩增速榜
2019上半年,有4家上市公司业绩增速超过百倍,其中排名第一的腾达建设更是达到666倍以上的净利增长。
数据来源:东方财富Choice数据
5
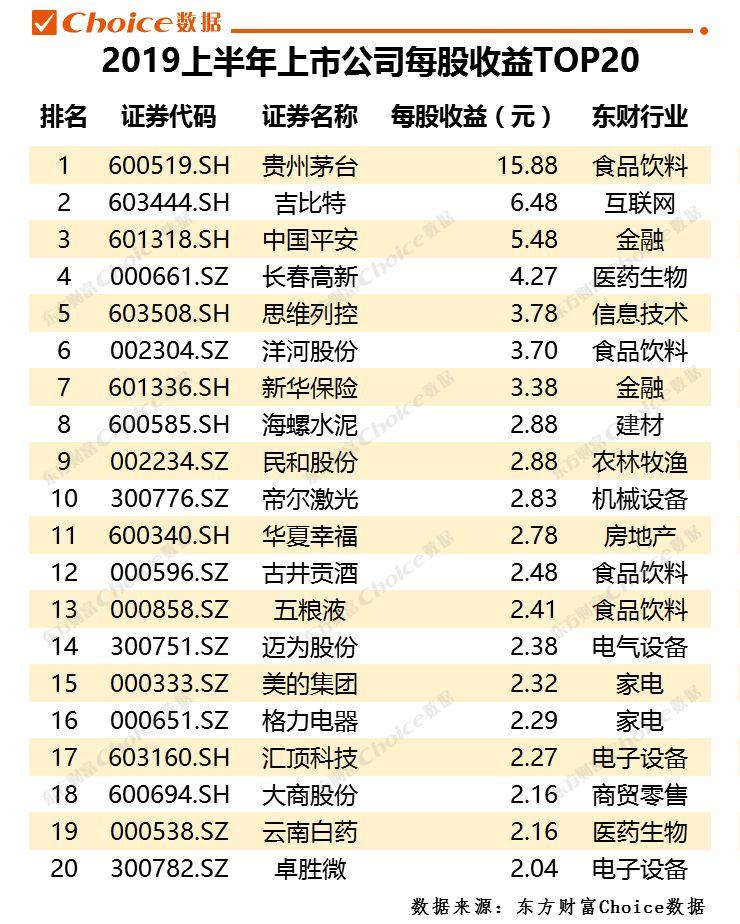
2019半年度高收益榜
每股收益方面,贵州茅台以15.88元的EPS大幅领先其他上市公司,吉比特和中国平安紧随其后,分别有6.48和5.48的EPS。
数据来源:东方财富Choice数据
6
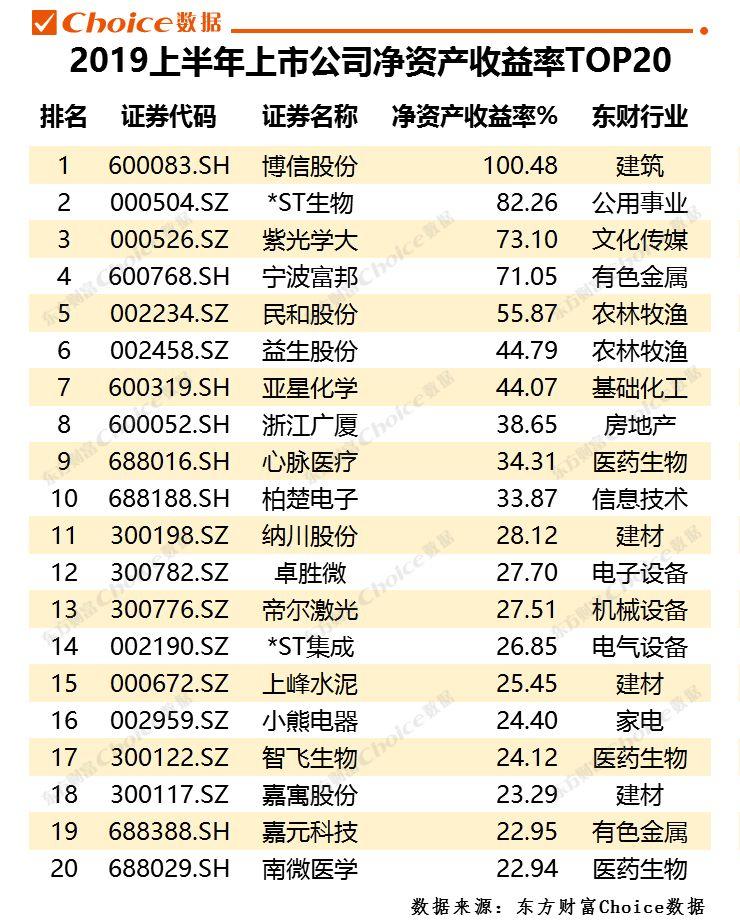
2019半年度回报排行榜
净资产收益率方面,博信股份超过100%;另有*ST生物、紫光学大、宁波富邦三家公司ROE超过50%。
数据来源:东方财富Choice数据
7
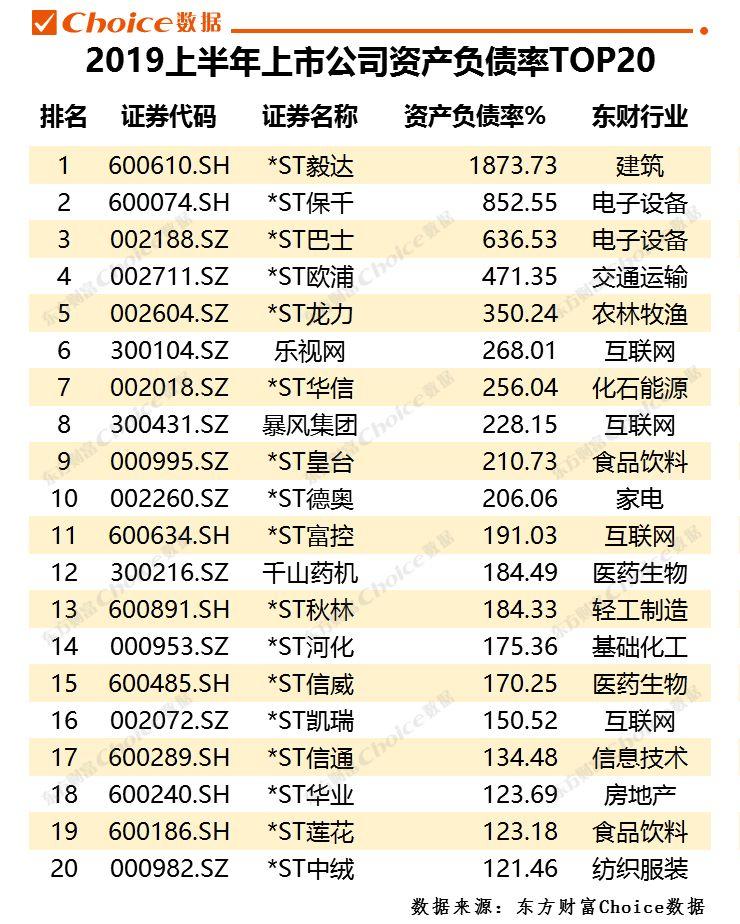
2019半年度负债排行榜
资产负债率方面,多数ST公司上榜,多达36家公司负债比率超过100%,ST毅达、*ST保千和ST巴士位列前三。
数据来源:东方财富Choice数据
8
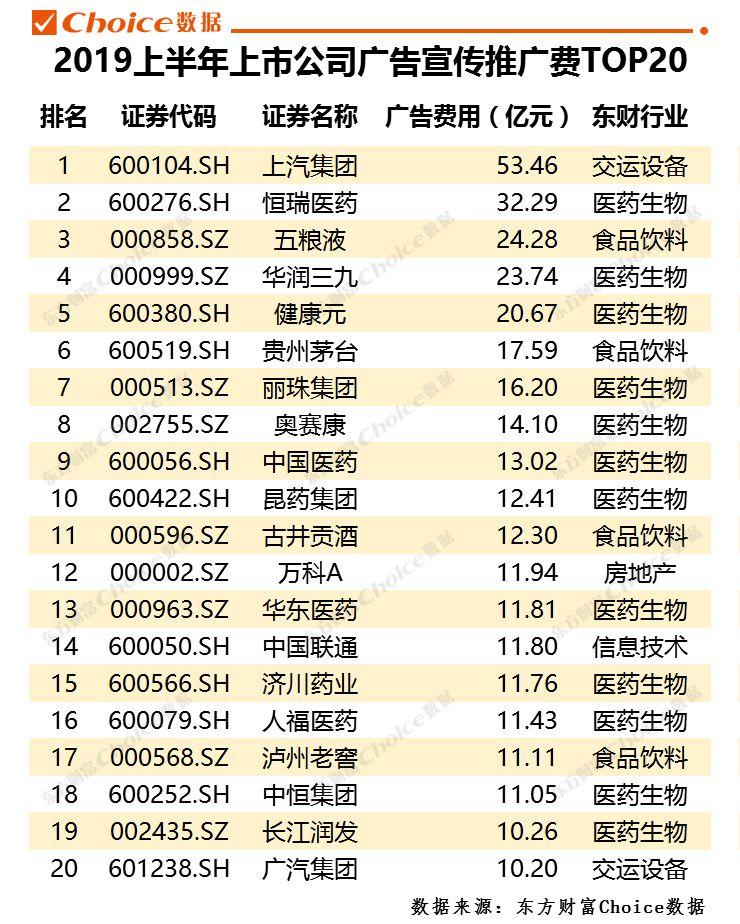
2019半年度品宣排行榜
品牌宣传方面,5家公司半年度广告费用投入超过20亿元,其中上汽集团和恒瑞医药以53.46亿元和32.29亿元居前列。榜单中,医药生物和食品饮料行业公司占多数。
数据来源:东方财富Choice数据
9
2019半年度研发排行榜
研发投入方面,6家公司半年度研发费用投入超过50亿元。中国石油、中国铁建和中兴通讯位居前列。
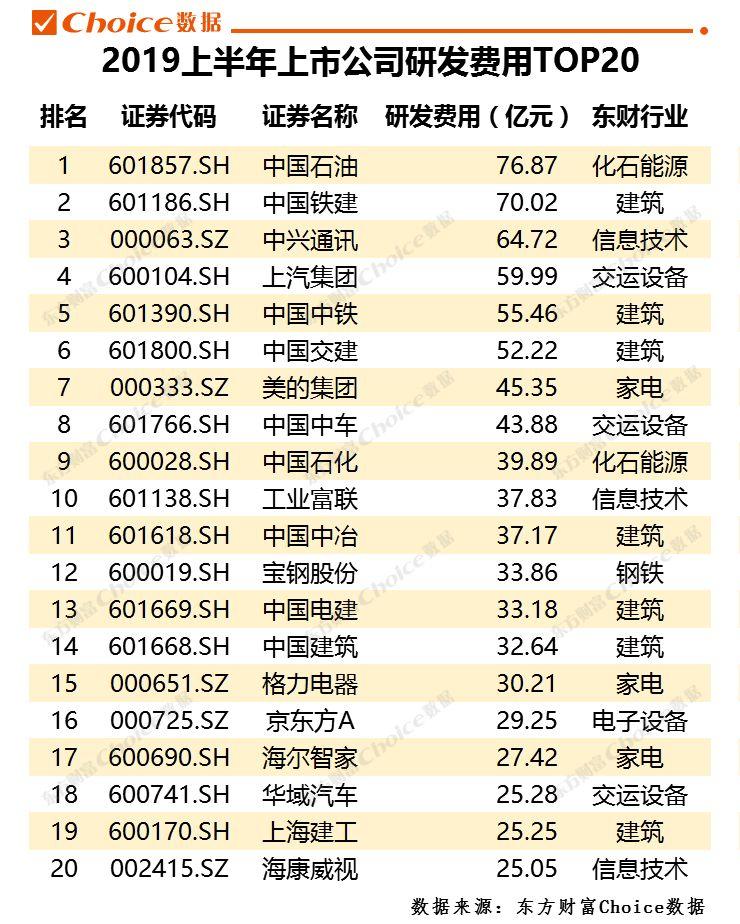
数据来源:东方财富Choice数据
10
2019半年度现金流排行榜
现金流的充沛程度方面,贵州茅台位居两市第一,其每股经营现金净流量达到19.17元,泰禾集团和华夏银行均超过10元。
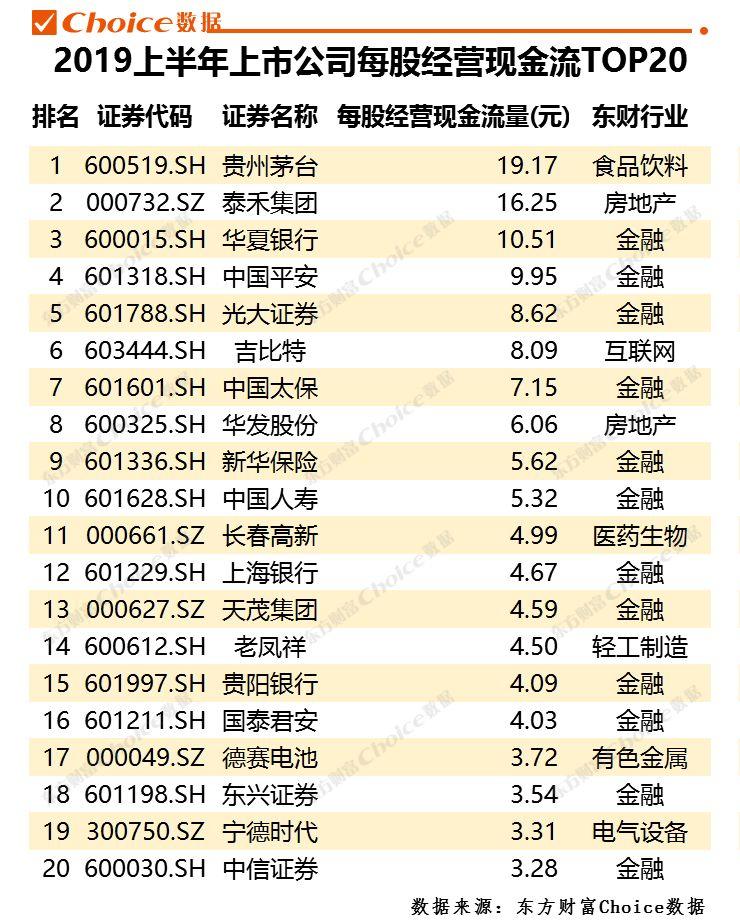
数据来源:东方财富Choice数据
11
2019半年度最会投资排行榜
2019上半年最会投资的上市公司依然属于两大保险公司中国人寿和中国平安,投资收益分别达到804.2亿元和443.98亿元。另有7家公司投资收益超过100亿元。
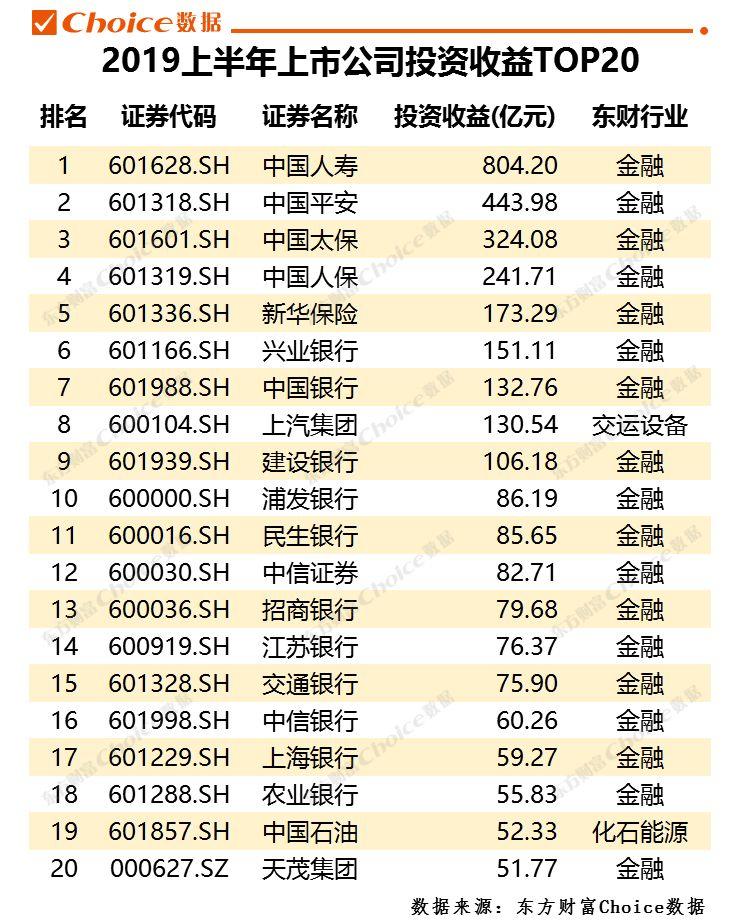
数据来源:东方财富Choice数据
仅供投资者参考,不构成投资建议


More Content


