最新出炉!2019中国企业500强榜单:茅台利润率最高,华为研发费用投入最多
作者: 梁倩
来源: 经济参考网
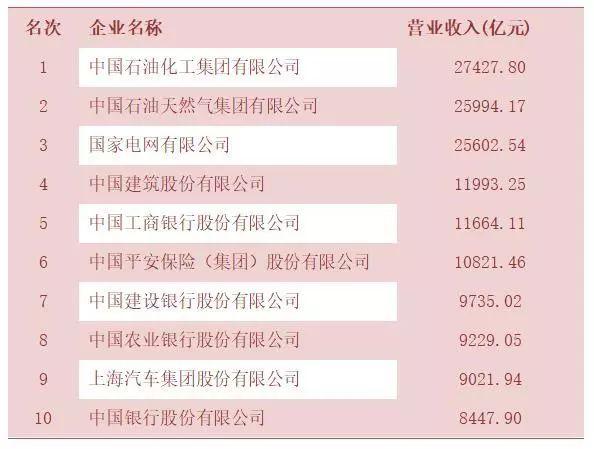
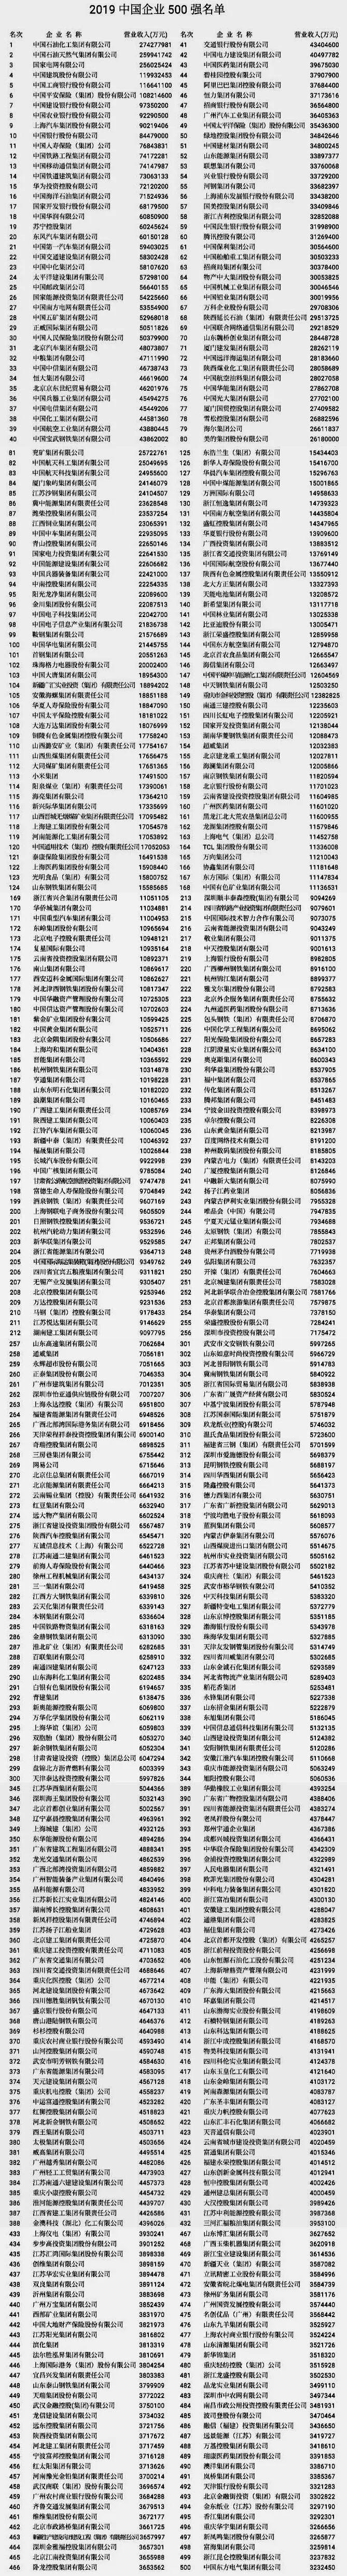
9月1日,中国企业联合会、中国企业家协会发布2019中国企业500强排行榜,中国石化、中国石油、国家电网分别以27427.8亿元、25994.17亿元、25602.54亿元营业收入分列排行榜前三位。榜单排名第六位的中国平安营业收入首次突破万亿元,也是500强企业万亿俱乐部中首个民营企业。
2019中国企业500强企业合计营业收入达79.1万亿元,较上年500强企业增加11.14%。排行榜入门门槛提升至323.25亿元,是自2002年统计中国企业500强来,连续17年提高。
2019中国企业500强营业收入前10强
那么,2019中国企业500强榜单中还有哪些亮点值得关注?小编带您一起看看。
万亿俱乐部、千亿俱乐部纷纷扩容
2019中国500强企业发展报告显示,2019中国企业500强中6家企业营业收入规模超过万亿元,分别是中国石化、中国石油、国家电网、中国建筑、中国工商银行、中国平安。其中,中国平安是2019年千亿俱乐部万亿级的新成员,也是500强企业万亿俱乐部中首个民营企业。
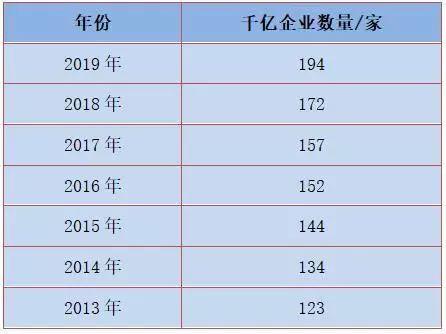
千亿俱乐部企业数量扩容明显。2019中国企业500强中,营业收入超过1000亿元的达到194家,较上年增加22家,创近年记录。大企业恒强特征更是明显。194家千亿俱乐部企业营业收入总额62.11万亿元,占500强企业营收总额的78.52%,单个企业平均营收达到3201.43亿元。
十八大以来,千亿企业持续增加,7年中增加了71家。
哪些企业最赚钱?
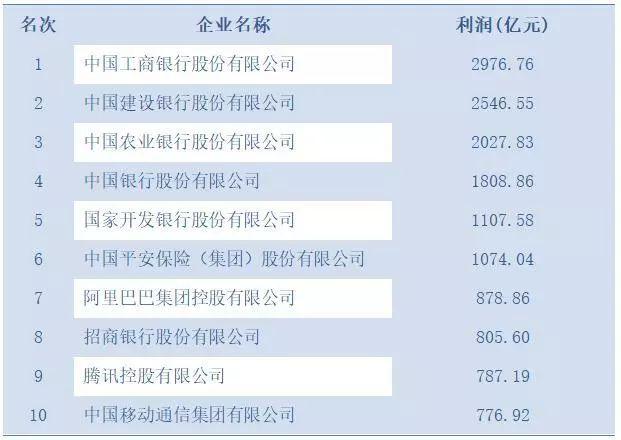
2019中国企业500强共实现利润总额44864.25亿元,较上年增长20.74%;实现归属母公司的净利润总额35320.95亿元,较上年增长10.28%;净资产利润率方面,实现净资产利润率9.65%,较上年提高0.11个百分点。
2019中国企业500强净利润前10强
非银企业盈利有所改善,2019中国企业500强中,481家非银企业收入利润率为2.86%,较2018年提升0.07个百分点,净资产利润率为8.34%,较2018年提高2.46个百分点。
从行业来看,服务业盈利水平好于制造业。具体来看,2019中国企业500强中服务业企业173家,收入利润率达7.47%,高于制造业企业的2.59%和其他行业企业的1.7%;净资产利润率10.55%,稍高于制造业企业的10.29%,高于其他类行业企业的4.85%。
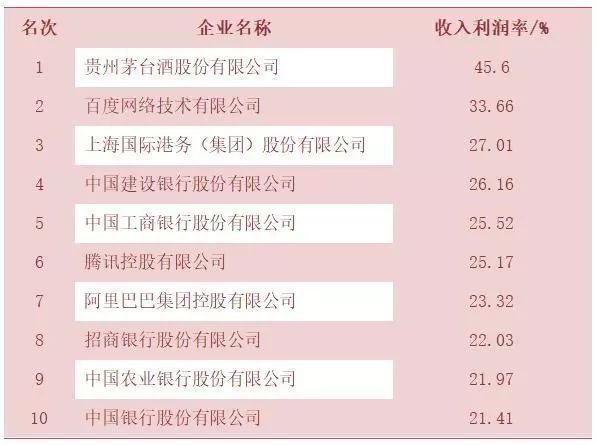
2019中国企业500强中,收入利润率前10强的企业有茅台、百度等。
2019中国企业500强收入利润率前10强
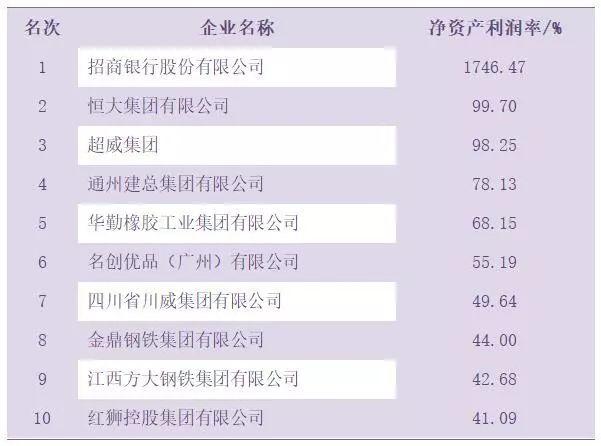
2019中国企业500强净资产利润率前10强
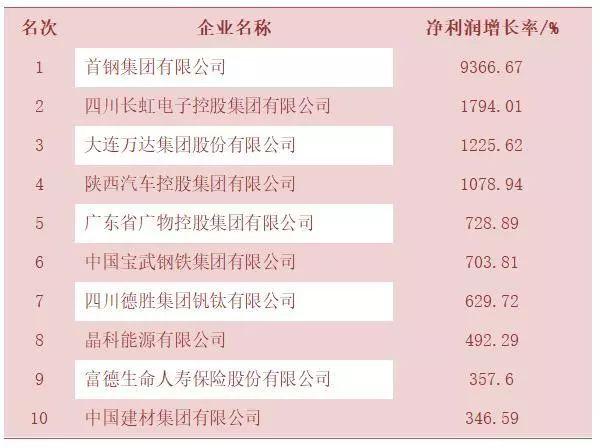
2019中国企业500强净利润增长率前10强
过半数500强企业研发强度提升
我国企业研发投入增幅显著。2019中国企业500强研发投入总额较2013年的500强企业投入增长了79.96%,年均增速为10.29%。根据2019中国企业500强中426家企业提供研发数据,426家企业投入研发费用总额为9765.48亿元,同比增长21.71%。
具体来看,超过半数企业的研发强度有所提升。426企业研发强度与上年同口径相比,224家企业的研发强度有所提升,占比52.58%。
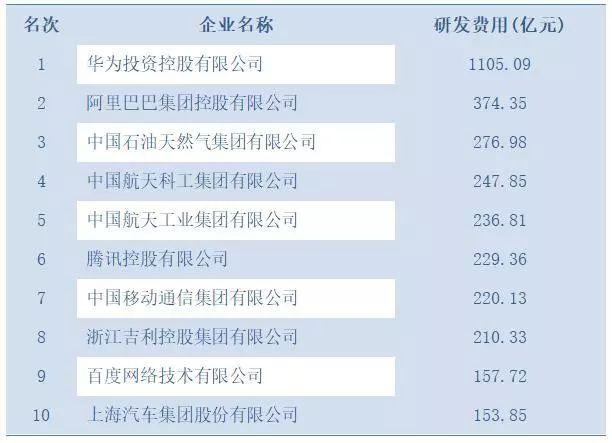
分行业来看,通信设备制造业高居首位。2019中国企业500强中,3家通信设备制造企业共投入研发费用1175.67亿元,行业平均研发强度为13.44%,显著高于排位第二的互联网服务业的6.14%。
2019中国企业500强研发费用投入10强
500强企业国际化程度不断提高
统计局数据显示,2018年我国对外全行业直接投资1298.3亿美元,同比增长4.2%。其中,我国境内投资者共对全球161个国家和地区的5735家境外企业进行了非金融类直接投资,累计投资1205亿美元。
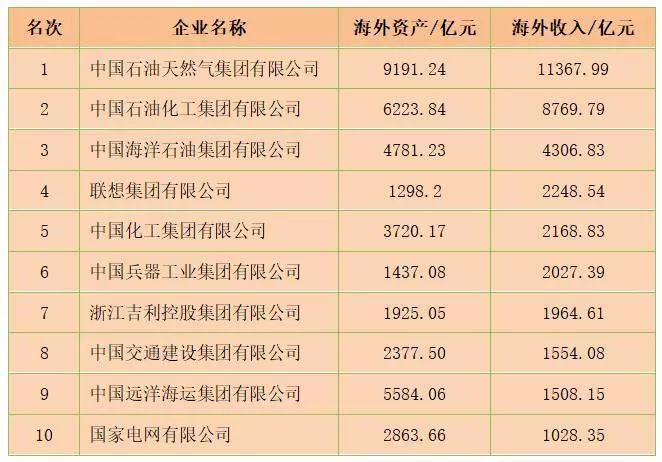
2019中国跨国公司100大入门门槛为98.58亿元,较上年大幅提高26.36亿元。具体来看,2019中国跨国公司100大海外资产总额95134亿元,较上年提高8.93%;海外营业收入为63475亿元,较上年提升6.41%;海外员工总数139.19万人,较上年提升7.31%。
2019中国跨国公司100大前10强
附:
Follow us
Find us on
Facebook,
Twitter ,
Instagram, and
YouTube or frequent updates on all things investing.Have a financial topic you would like to discuss? Head over to the
uSMART Community to share your thoughts and insights about the market! Click the picture below to download and explore uSMART app!

Disclaimers
uSmart Securities Limited (“uSmart”) is based on its internal research and public third party information in preparation of this article. Although uSmart uses its best endeavours to ensure the content of this article is accurate, uSmart does not guarantee the accuracy, timeliness or completeness of the information of this article and is not responsible for any views/opinions/comments in this article. Opinions, forecasts and estimations reflect uSmart’s assessment as of the date of this article and are subject to change. uSmart has no obligation to notify you or anyone of any such changes. You must make independent analysis and judgment on any matters involved in this article. uSmart and any directors, officers, employees or agents of uSmart will not be liable for any loss or damage suffered by any person in reliance on any representation or omission in the content of this article. The content of the article is for reference only and does not constitute any offer, solicitation, recommendation, opinion or guarantee of any securities, virtual assets, financial products or instruments. Regulatory authorities may restrict the trading of virtual asset-related ETFs to only investors who meet specified requirements. Any calculations or images in the article are for illustrative purposes only.
Investment involves risks and the value and income from securities may rise or fall. Past performance is not indicative of future performance. Please carefully consider your personal risk tolerance, and consult independent professional advice if necessary.


