


来源:wind
截至8月31日凌晨,2019年A股半年报业绩披露正式收官,除了*ST长生因自身原因无法按时披露外,A股其余3679家公司上半年财务数据已全部出炉。
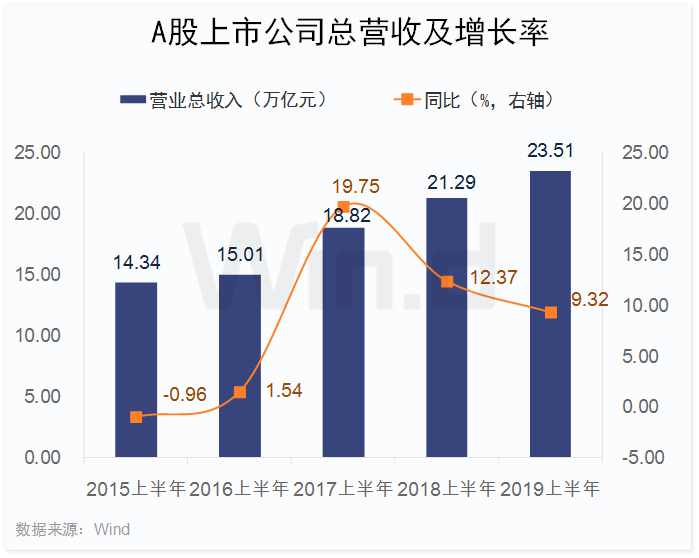
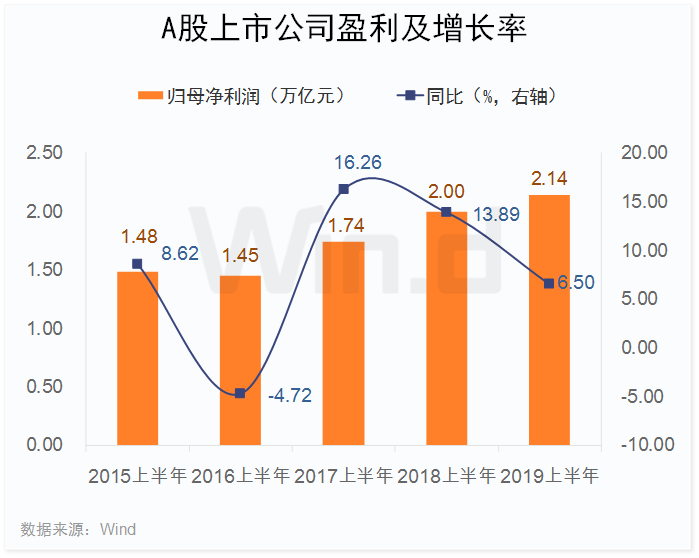
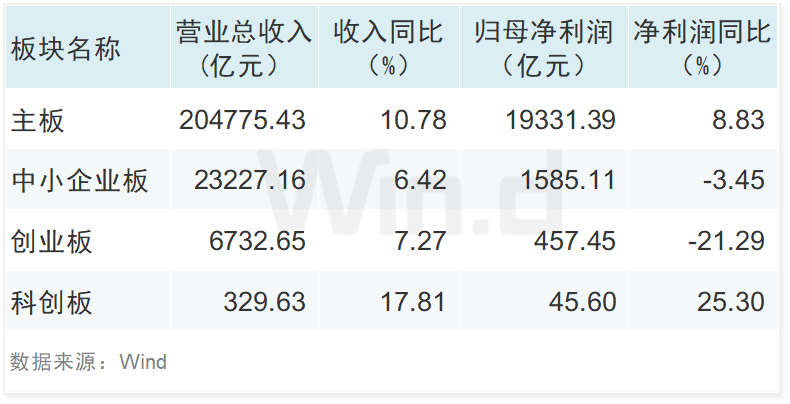
总体上看,上半年A股上市公司合计实现营业总收入23.51万亿元,同比增长9.32%,实现净利润2.14万亿元,同比增长6.5%。其中主板业绩稳健增长,中小创净利润下滑明显。
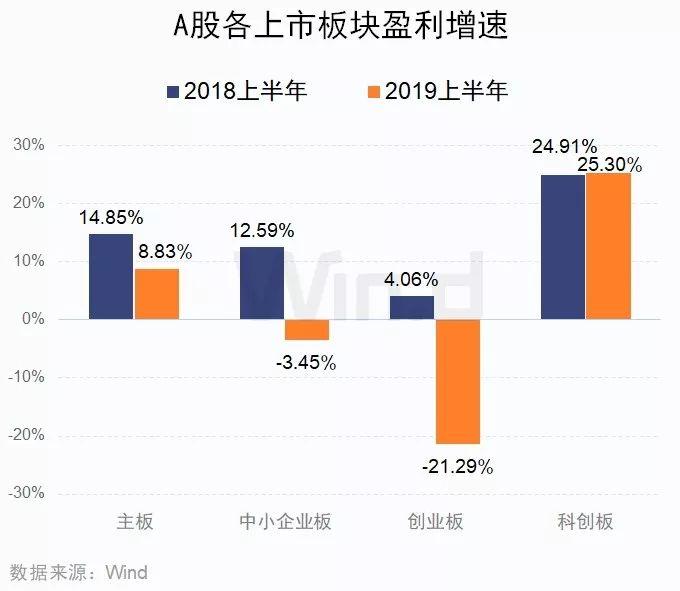
科创板成长性十足,营收和净利润均呈现两位数的增长。上半年,28只科创板公司合计实现营收329.63亿元,同比增长17.81%;实现净利润45.6亿元,同比增长25.3%。
上半年,保险、券商板块盈利面显著改善,汽车和TMT公司业绩不佳,同比降幅均超过三成。
总览
2019年上半年A股上市公司合计实现营业总收入23.51万亿元,同比增长9.32%;实现净利润(备注:以下统计均为归属母公司净利润)2.14万亿元,同比增长6.5%。
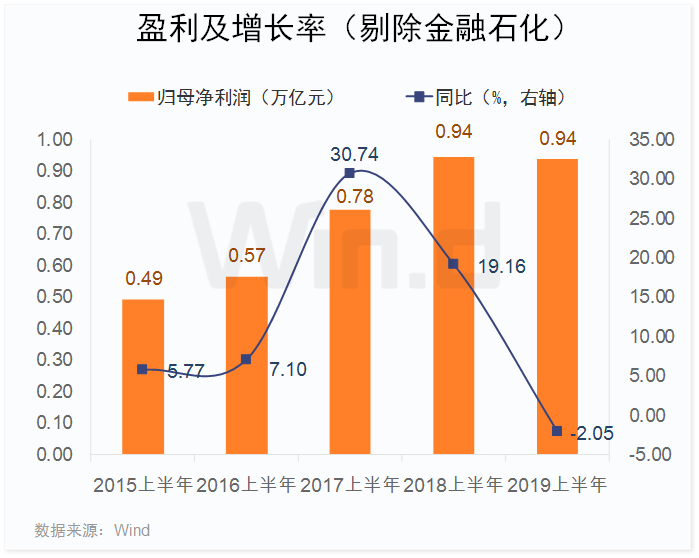
在剔除金融及两桶油后,上半年A股实现净利润0.94万亿元,同比下降2.05%。
上半年,主板业绩稳健增长,中小创净利润下滑明显;科创板则成长性十足,营收和净利润均呈现两位数的增长。
行业排行榜
01行业营收
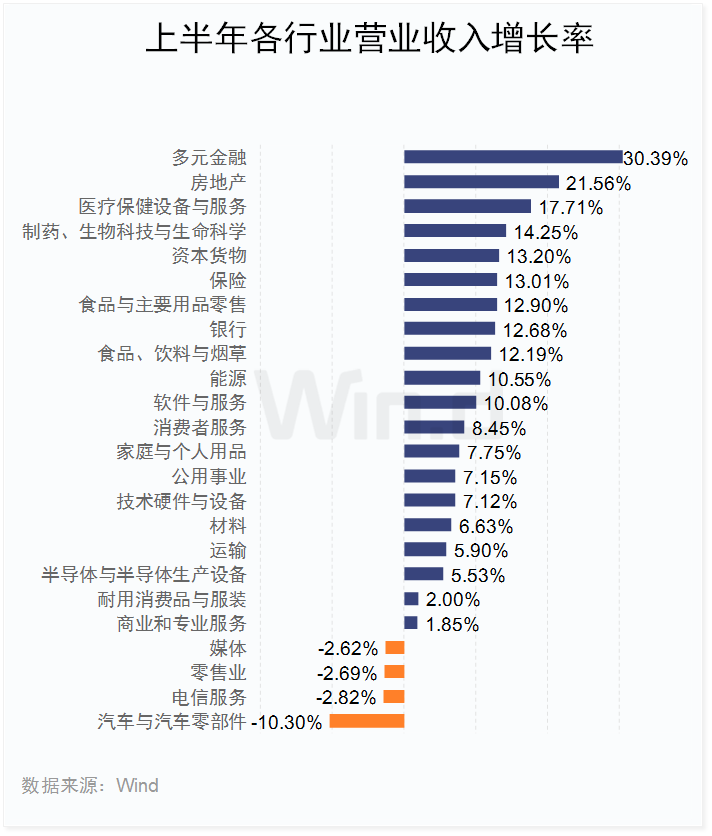
在Wind二级行业中,上半年,以券商为主的多元金融板块营收增长超过三成,位居首位;房地产(21.56%)、医疗保健设备与服务(17.71%)营收增幅位列第二第三。
02行业净利润
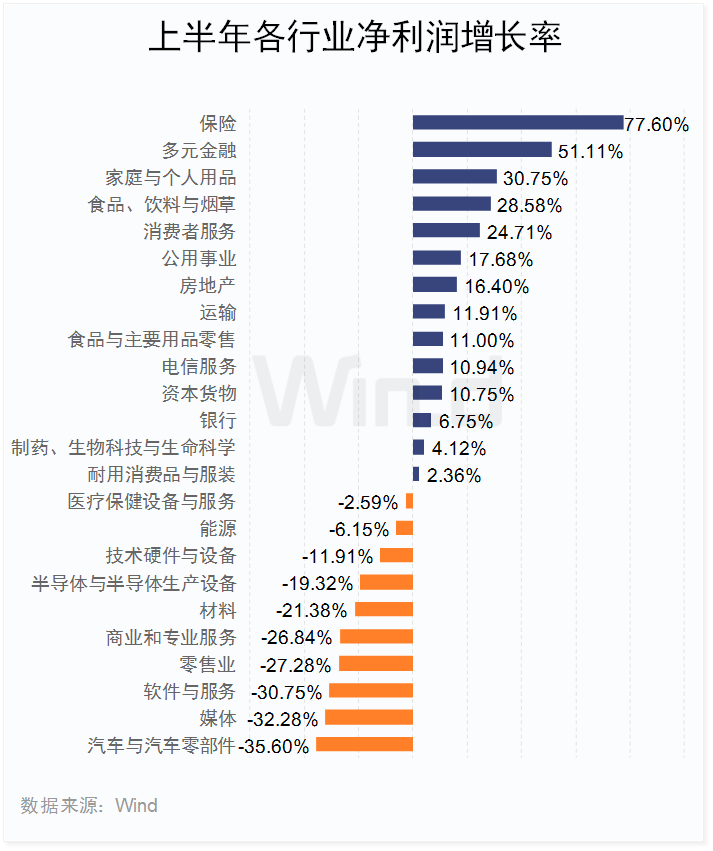
上半年,保险行业净利润同比增长77.6%,位居第一;多元金融紧随其后,增速达51.11%。
汽车和TMT公司业绩下滑,其中汽车与零部件行业净利润同比下降35.6%,媒体、软件与服务行业净利润降幅均超三成。
03行业毛利率
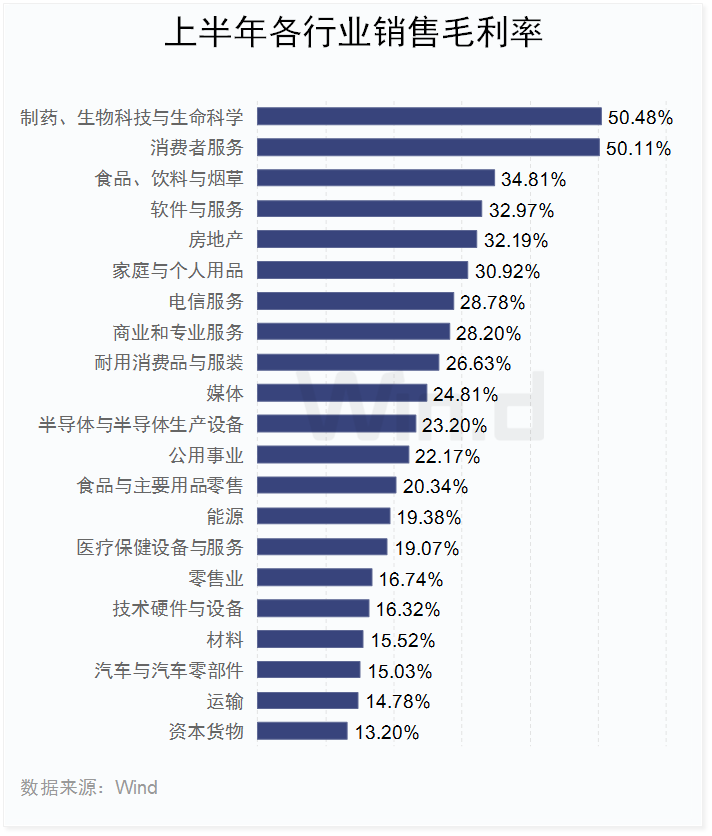
剔除金融业后,上半年,制药、生物科技与生命科学行业销售毛利率达50.48%,位居首位;消费者服务行业以50.11%的毛利率位列第二。
个股业绩排行榜
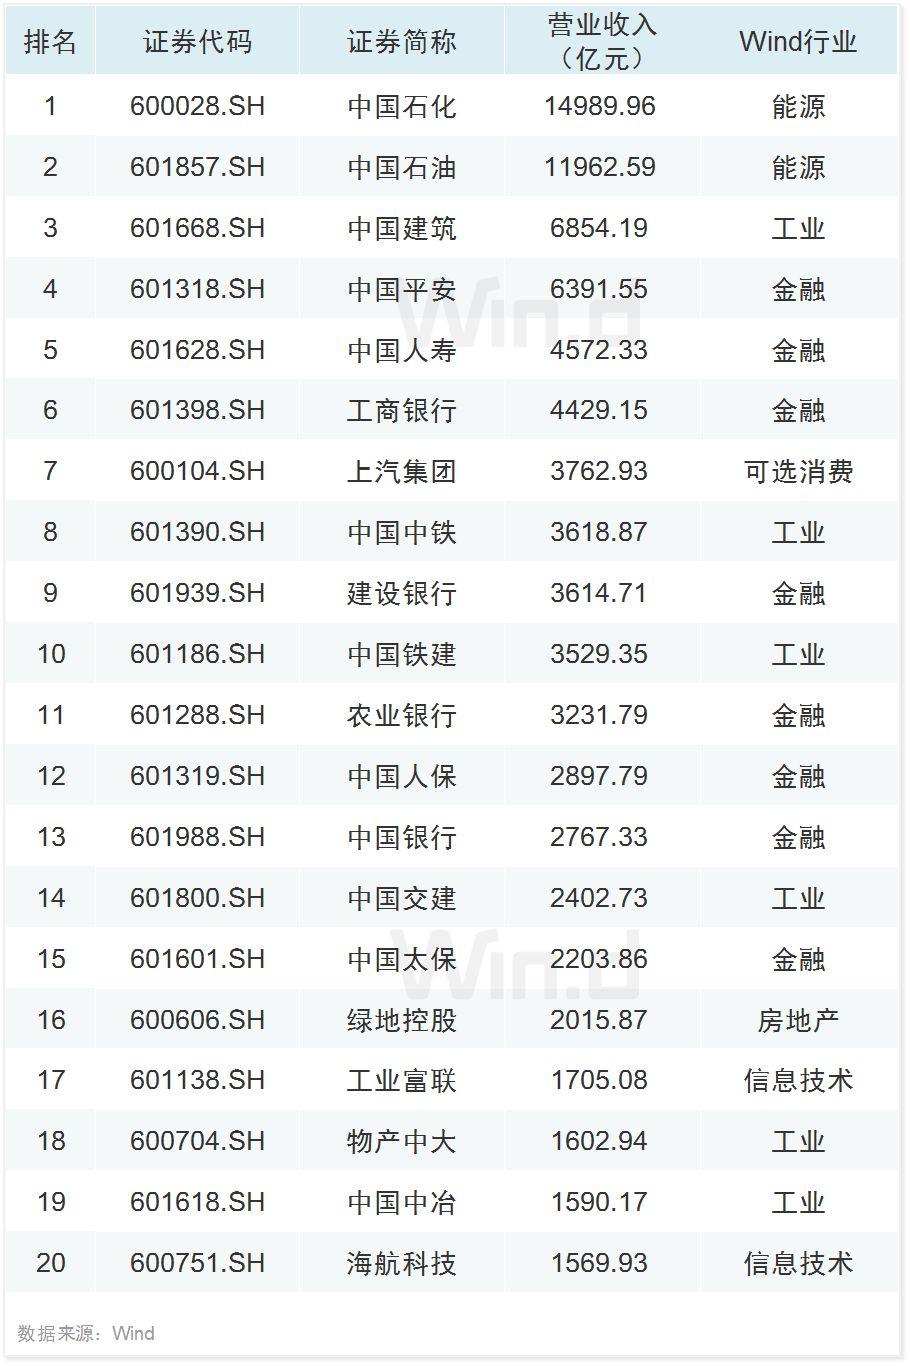
01营收规模榜TOP20
上半年,“两桶油”营收规模继续稳居前二,中石化营收约14990亿元居首。
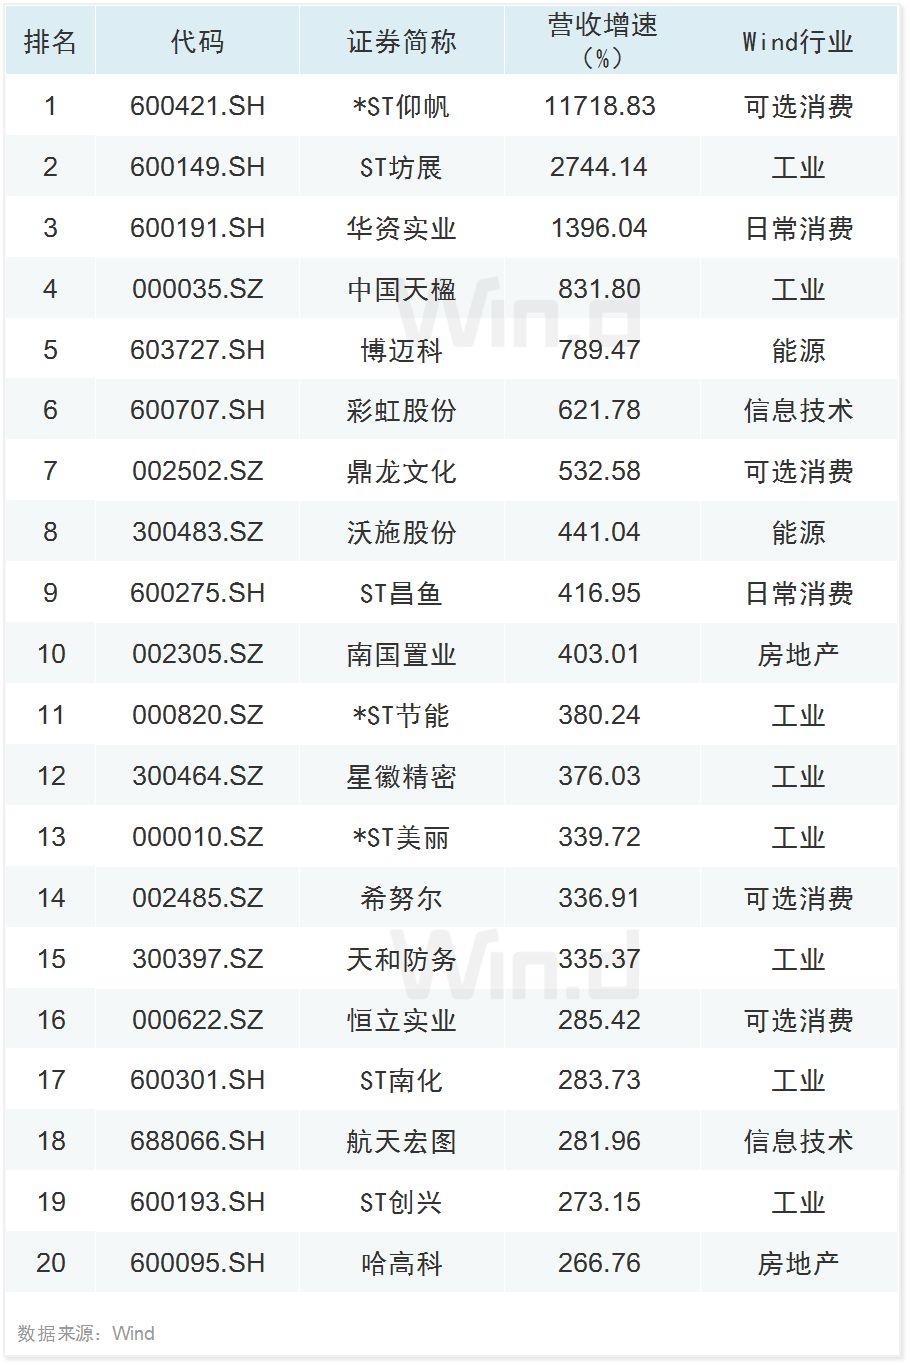
02营收增速榜TOP20
上半年,营收增速超过10倍的公司共有3家,分别为*ST仰帆、ST坊展、华资实业。
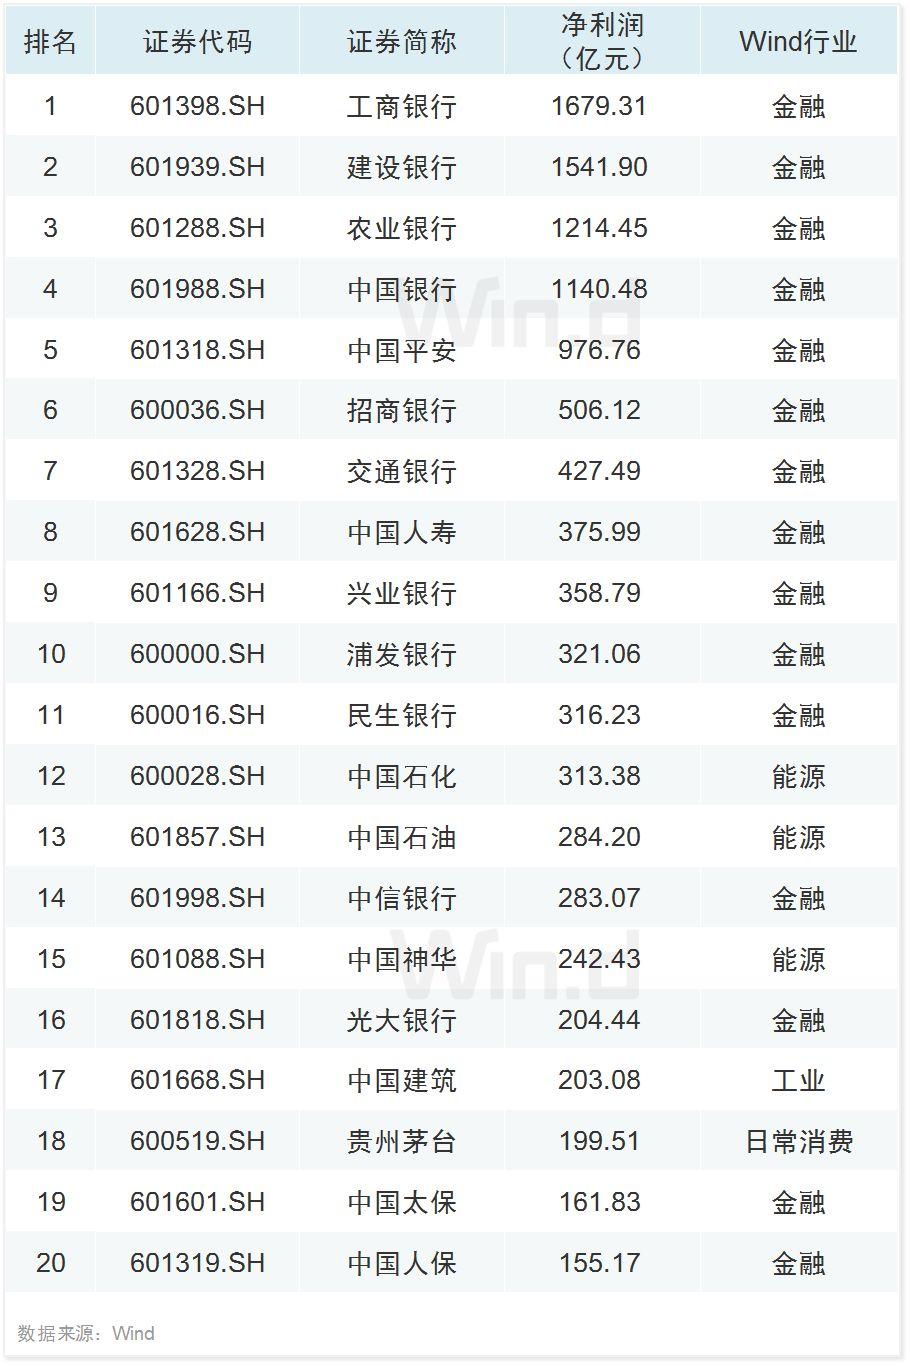
03盈利榜TOP20
上半年,四大行净利润均超过千亿,前11强均被金融股包揽。
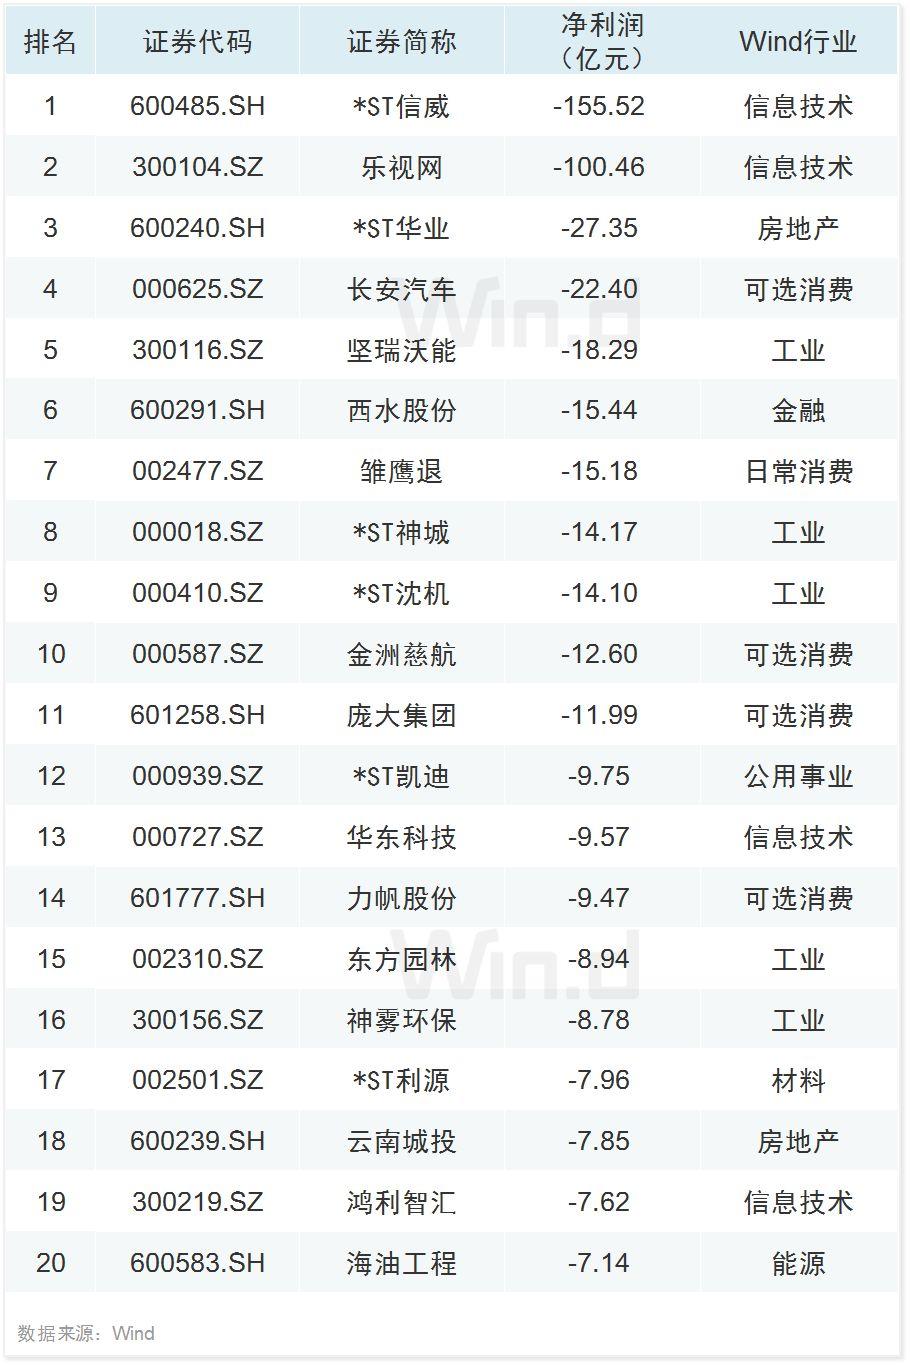
04亏损榜TOP20
上半年,有两家公司亏损超过百亿,*ST信威巨亏155.52亿元居首。
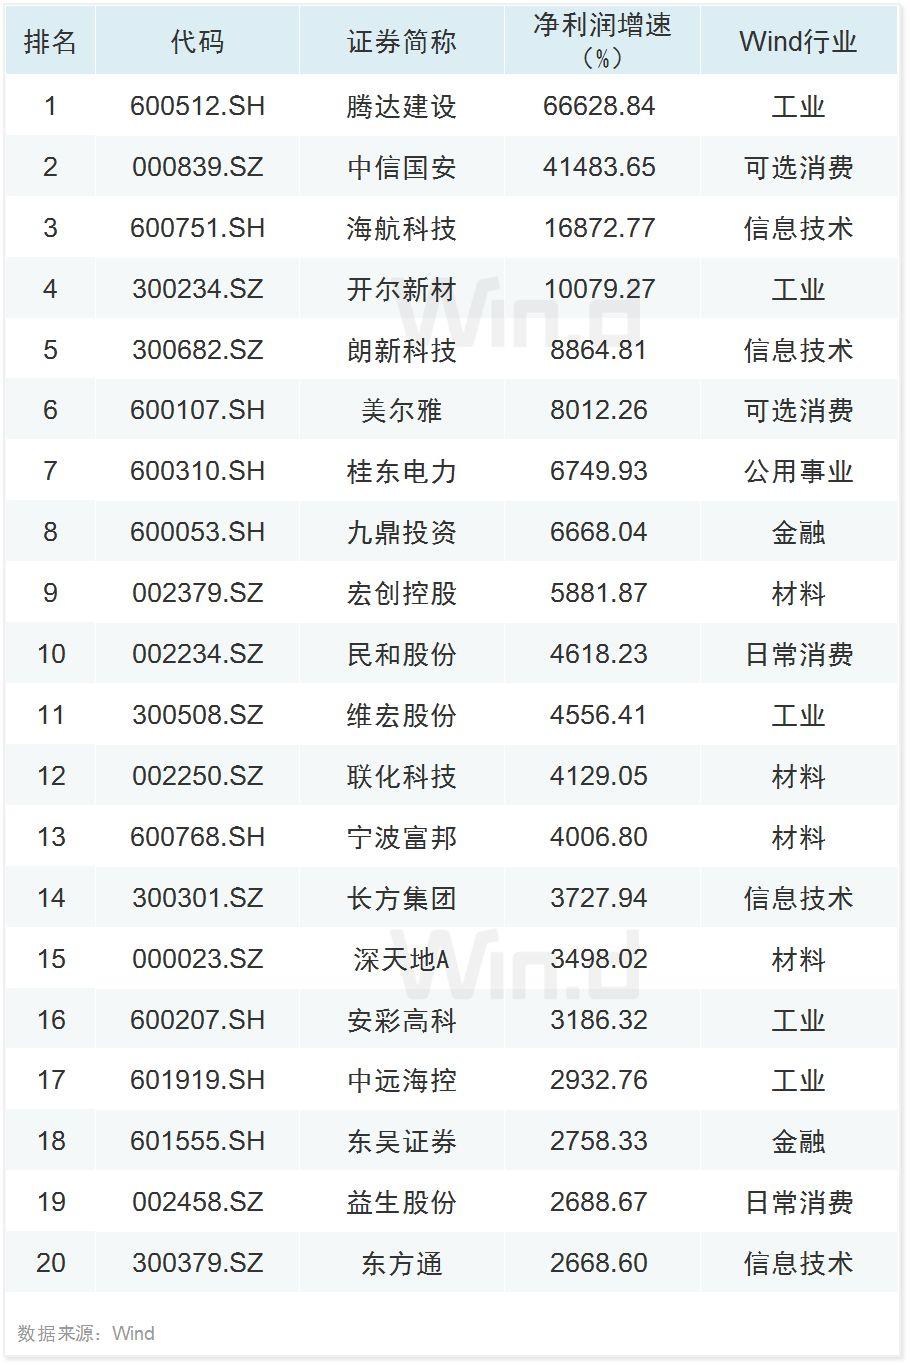
05盈利增幅榜TOP20
上半年,有4家公司净利润同比增逾百倍,腾达建设以超过666倍的增速居首。
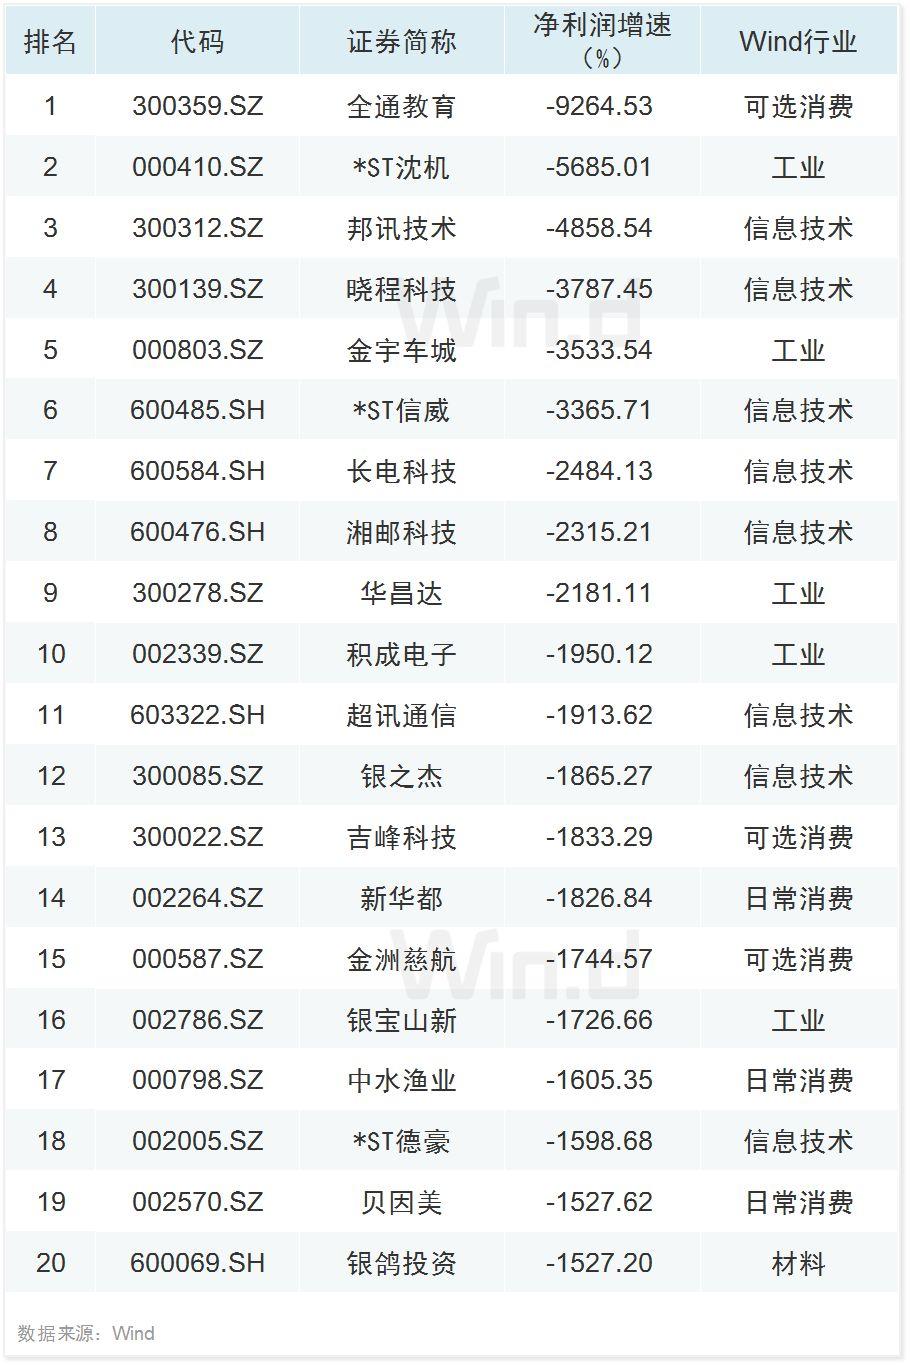
06盈利降幅榜TOP20
上半年,全通教育、*ST沈机、邦讯技术业绩降幅居前。
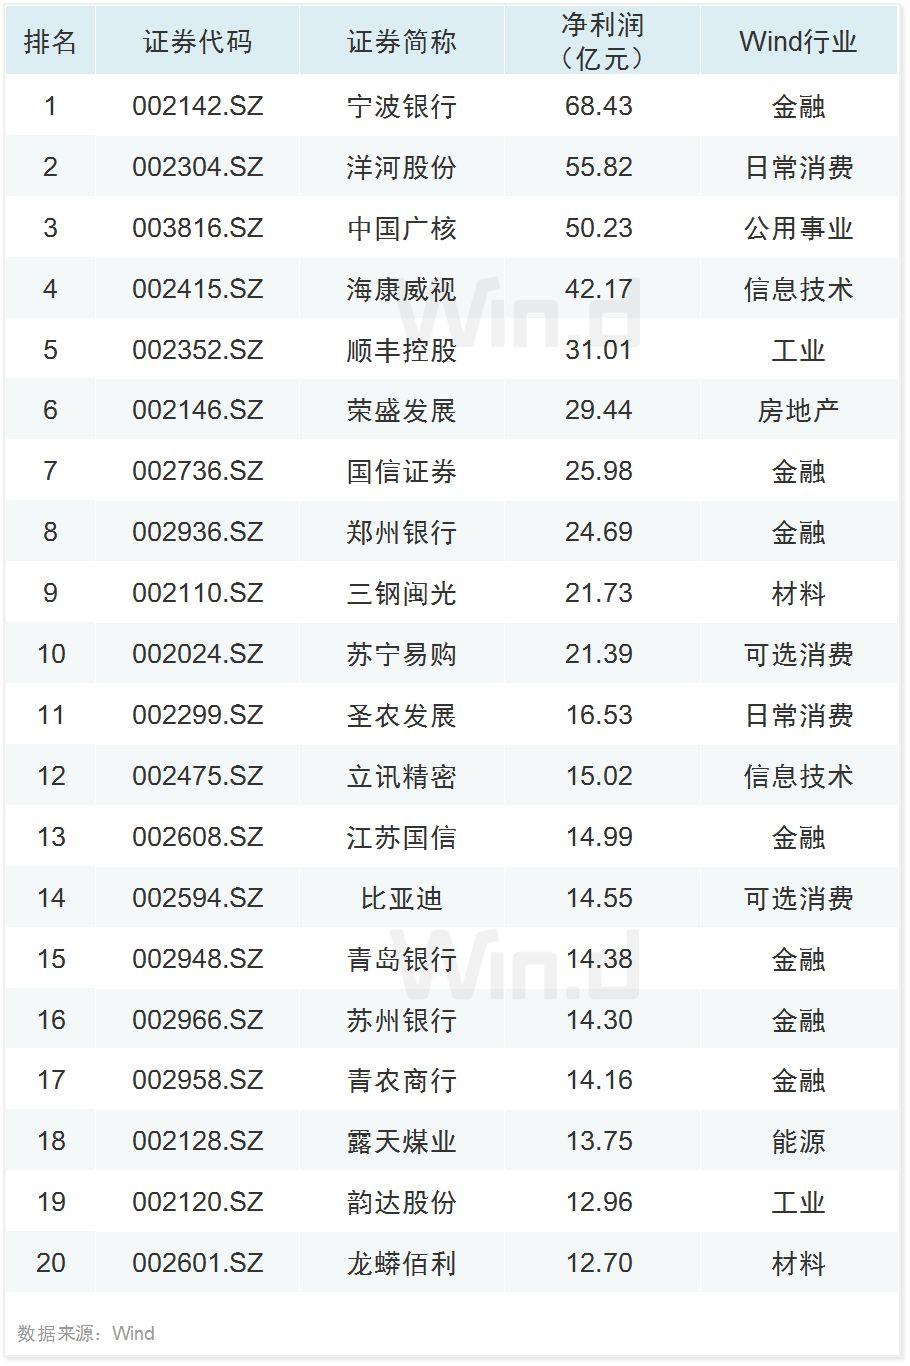
07中小板盈利榜TOP20
上半年,中小板公司中,宁波银行实现净利润68.43亿元居首,洋河股份、中国广核分别以55.82亿元、50.23亿元的净利润位列第二第三。
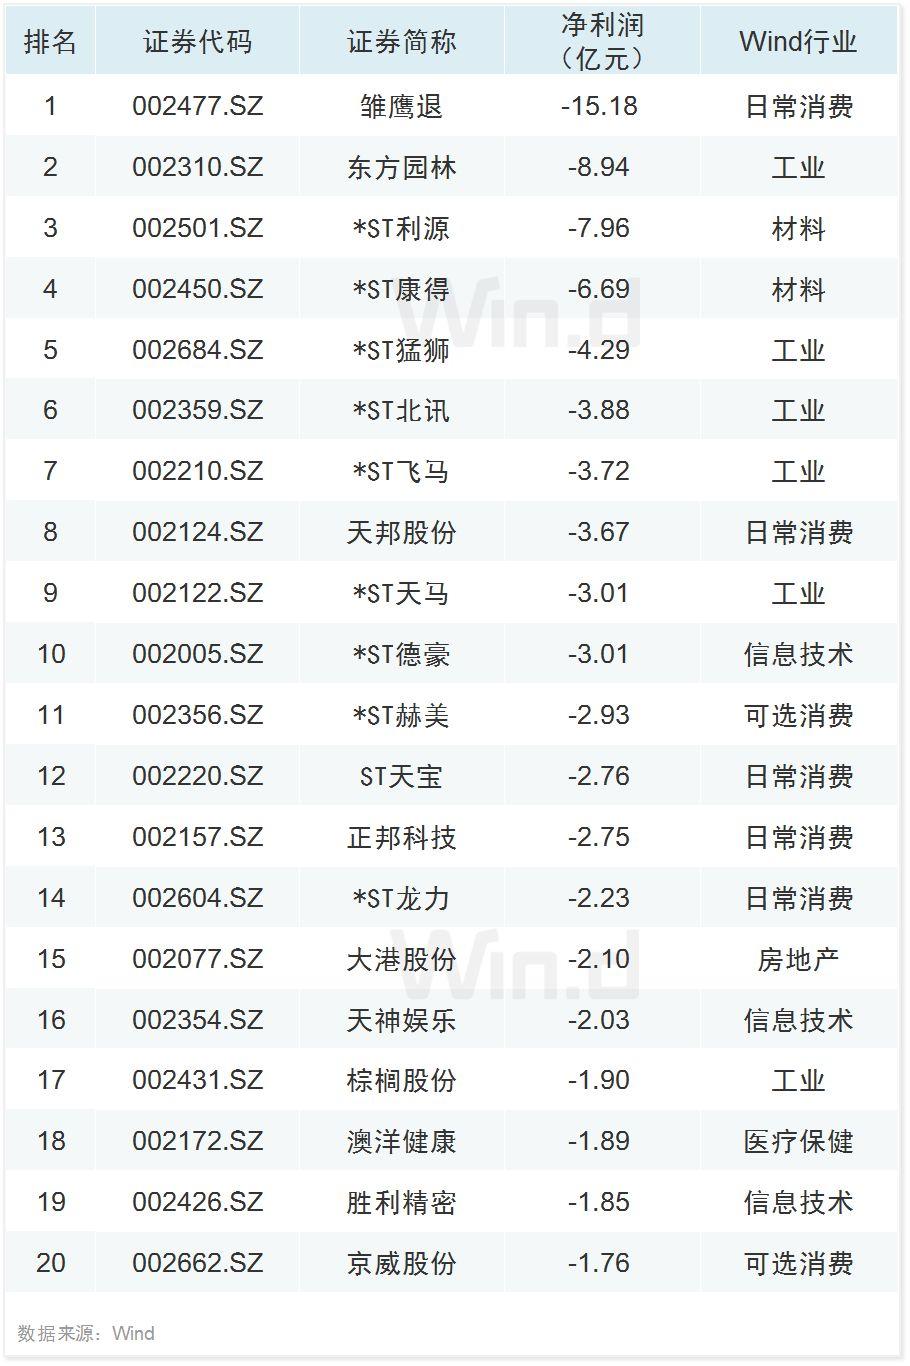
08中小板亏损榜TOP20
上半年,中小板公司中,雏鹰退亏损15.18亿元居首。
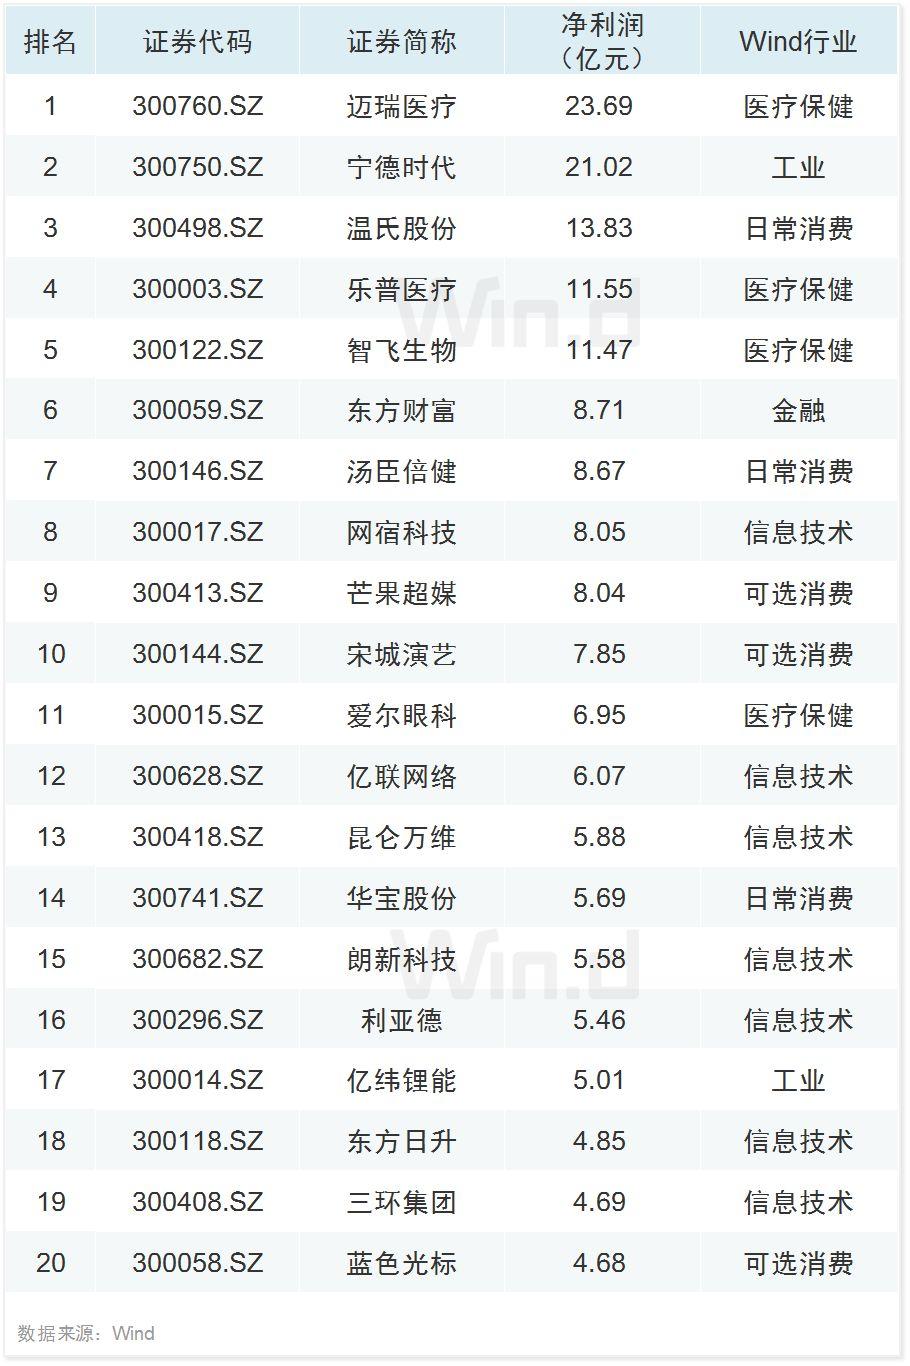
09创业板盈利榜TOP20
上半年,创业板公司中,迈瑞医疗、宁德时代净利润均超过20亿元位列前二。
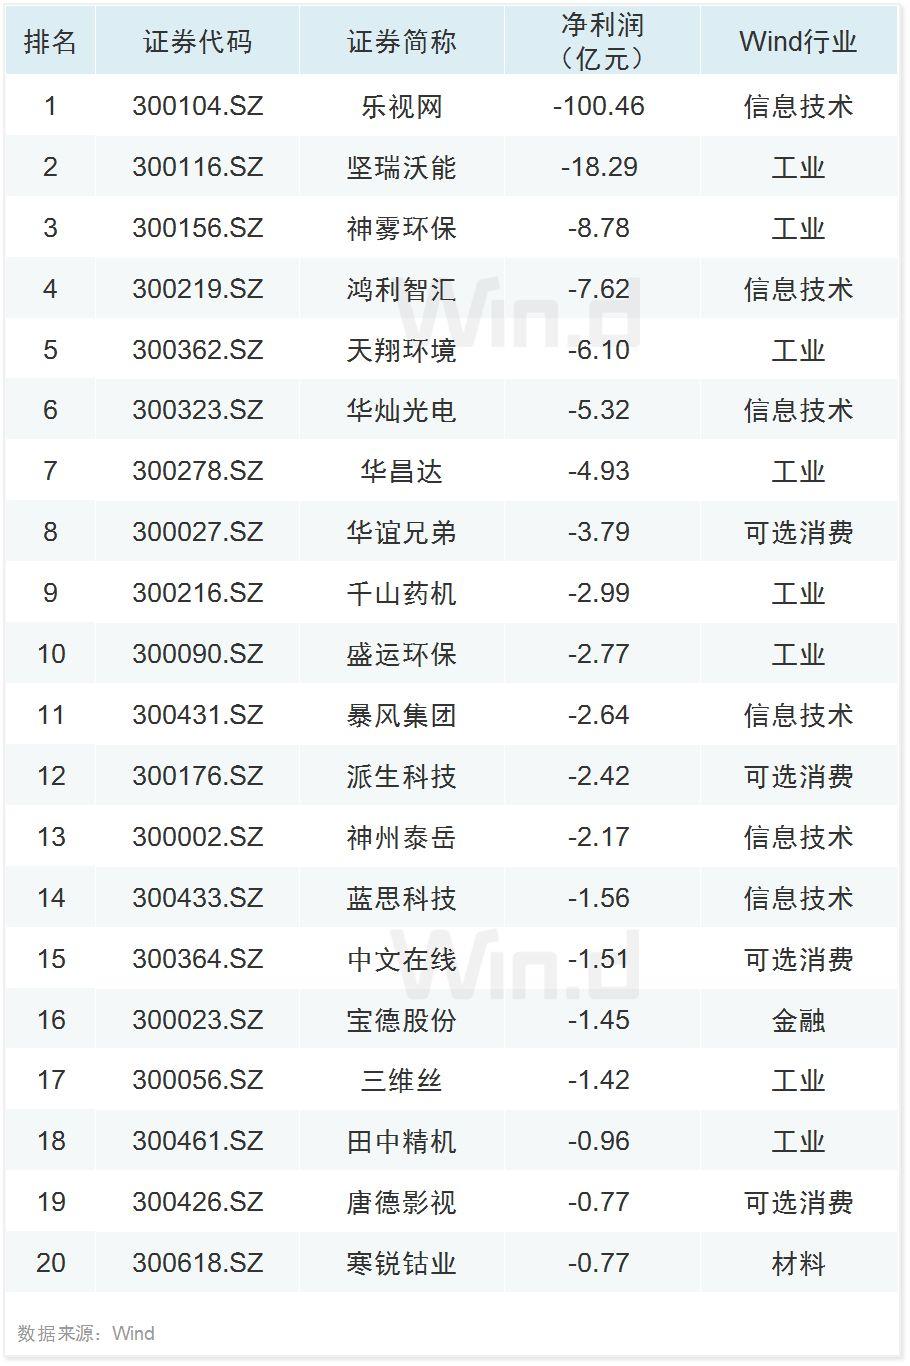
10创业板亏损榜TOP20
上半年,创业板公司中,乐视网亏损百亿元居首。
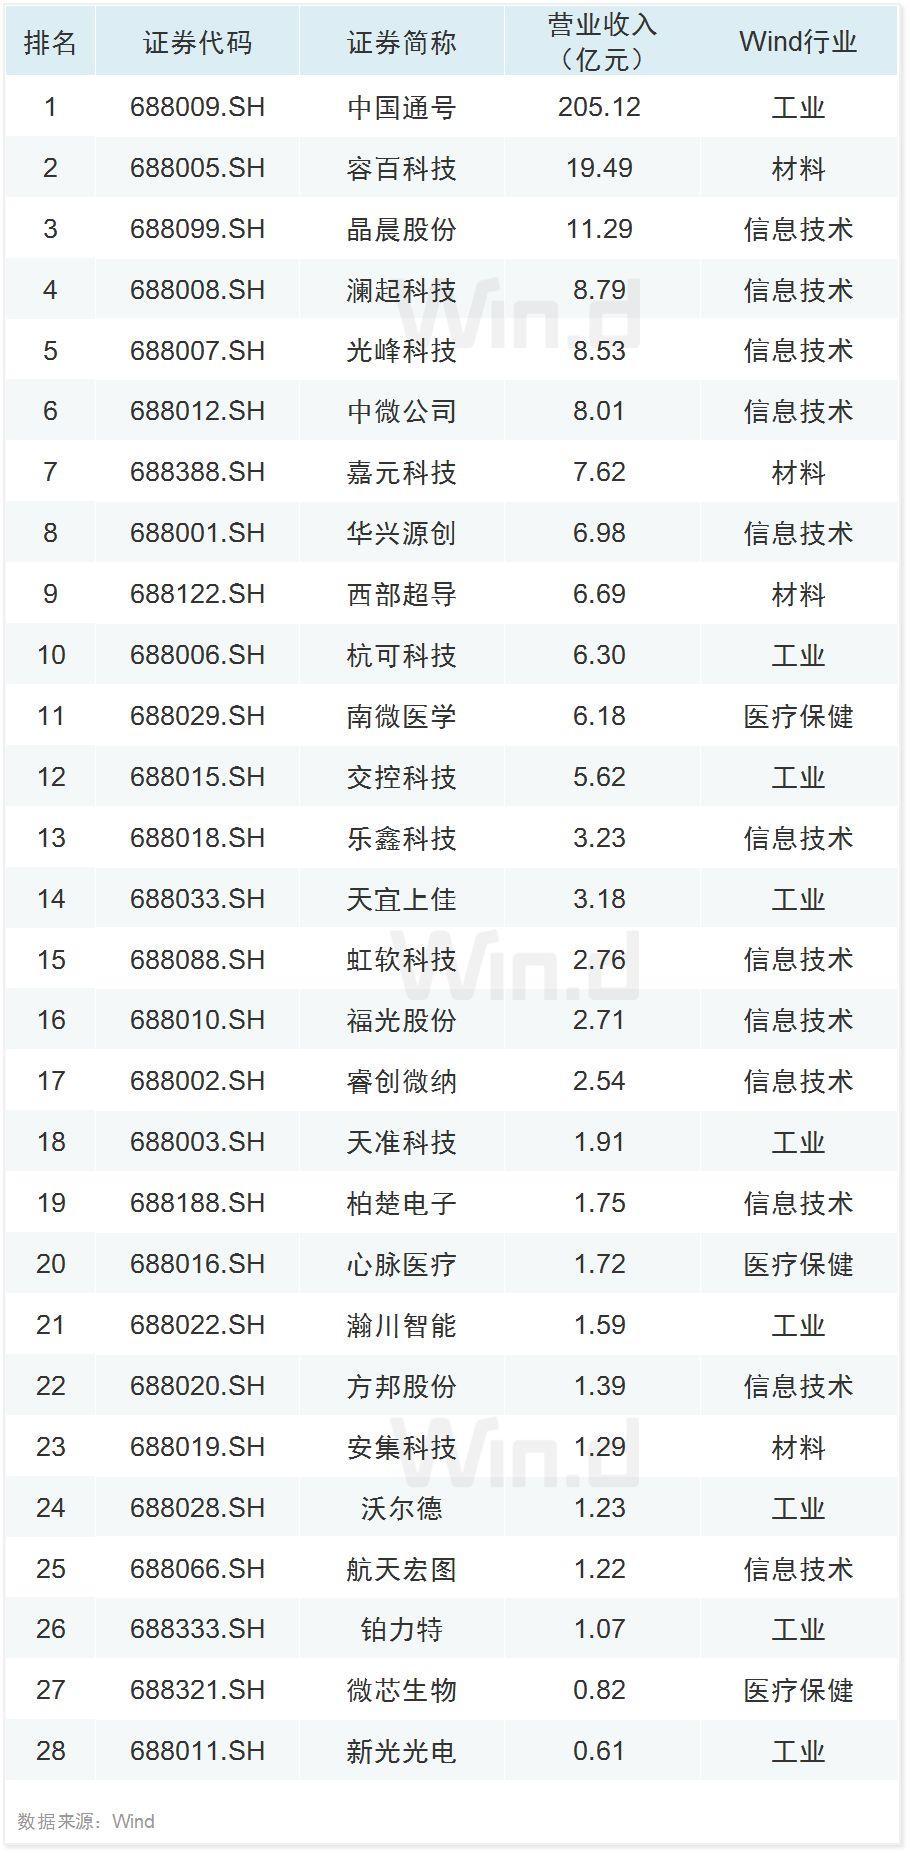
11科创板营收榜
科创板28家公司中,中国通号上半年营收超过200亿元位居首位,容百科技、晶晨股份分别以19.49亿元、11.29亿元的营业收入紧随其后。
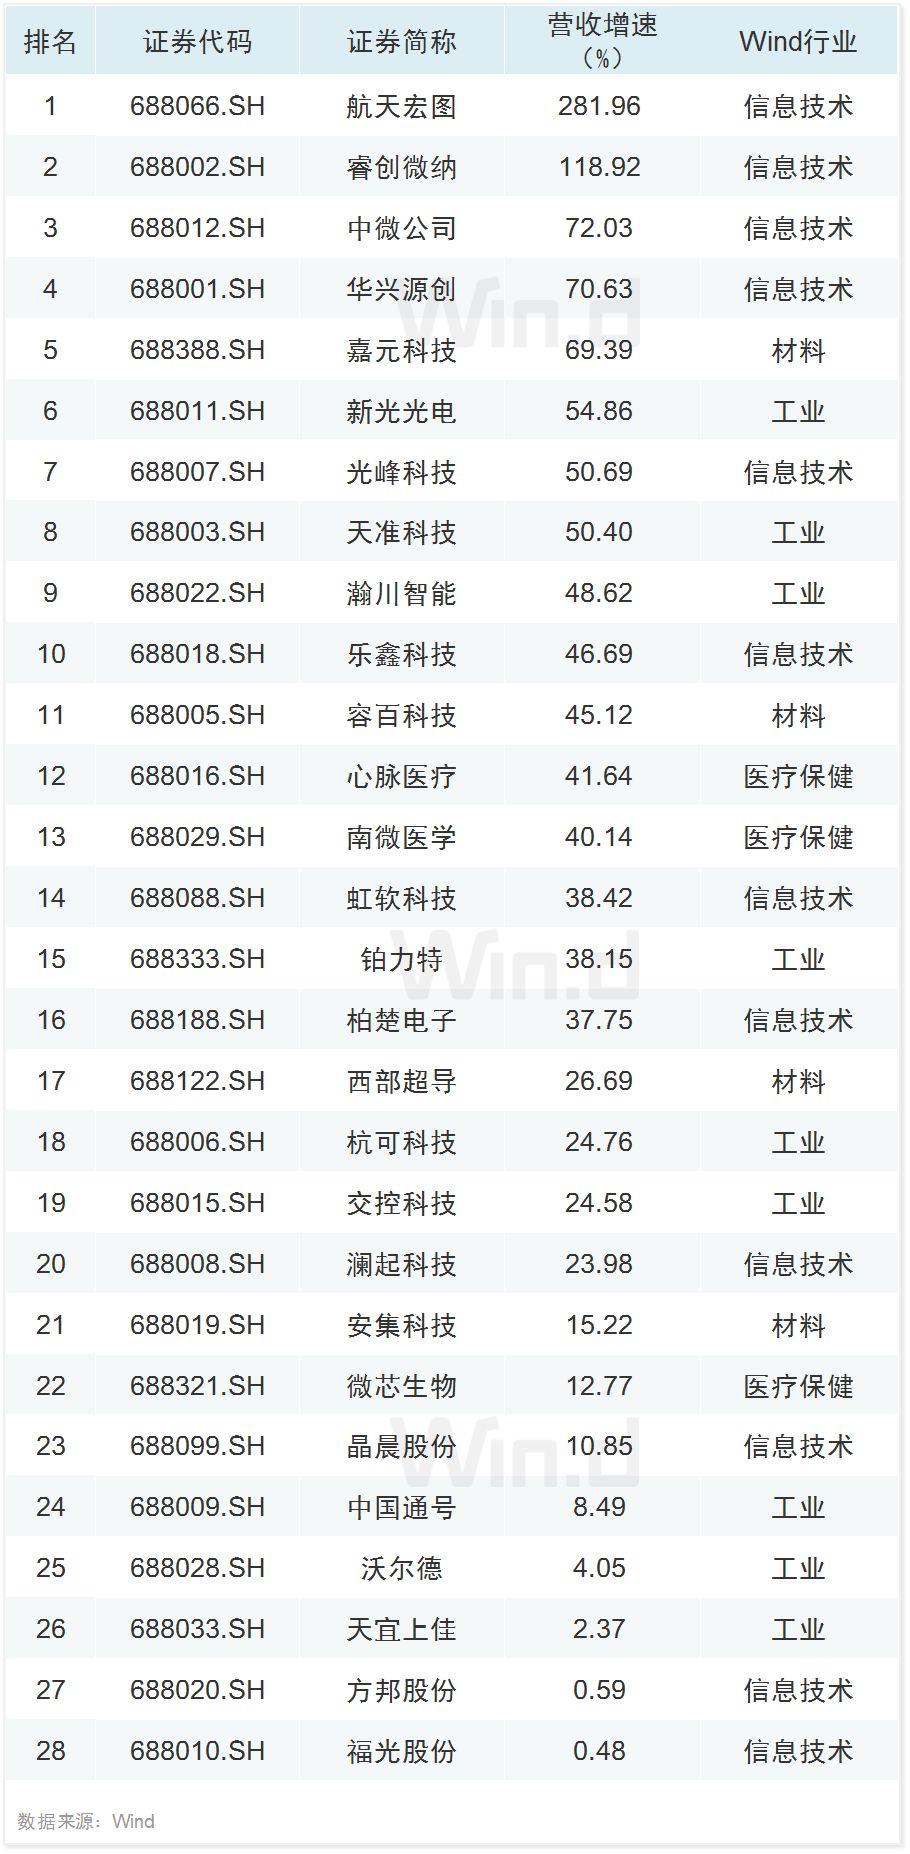
12科创板营收增速榜
上半年,科创板公司中,航天宏图、睿创微纳营收同比均实现翻番,位列前两位。
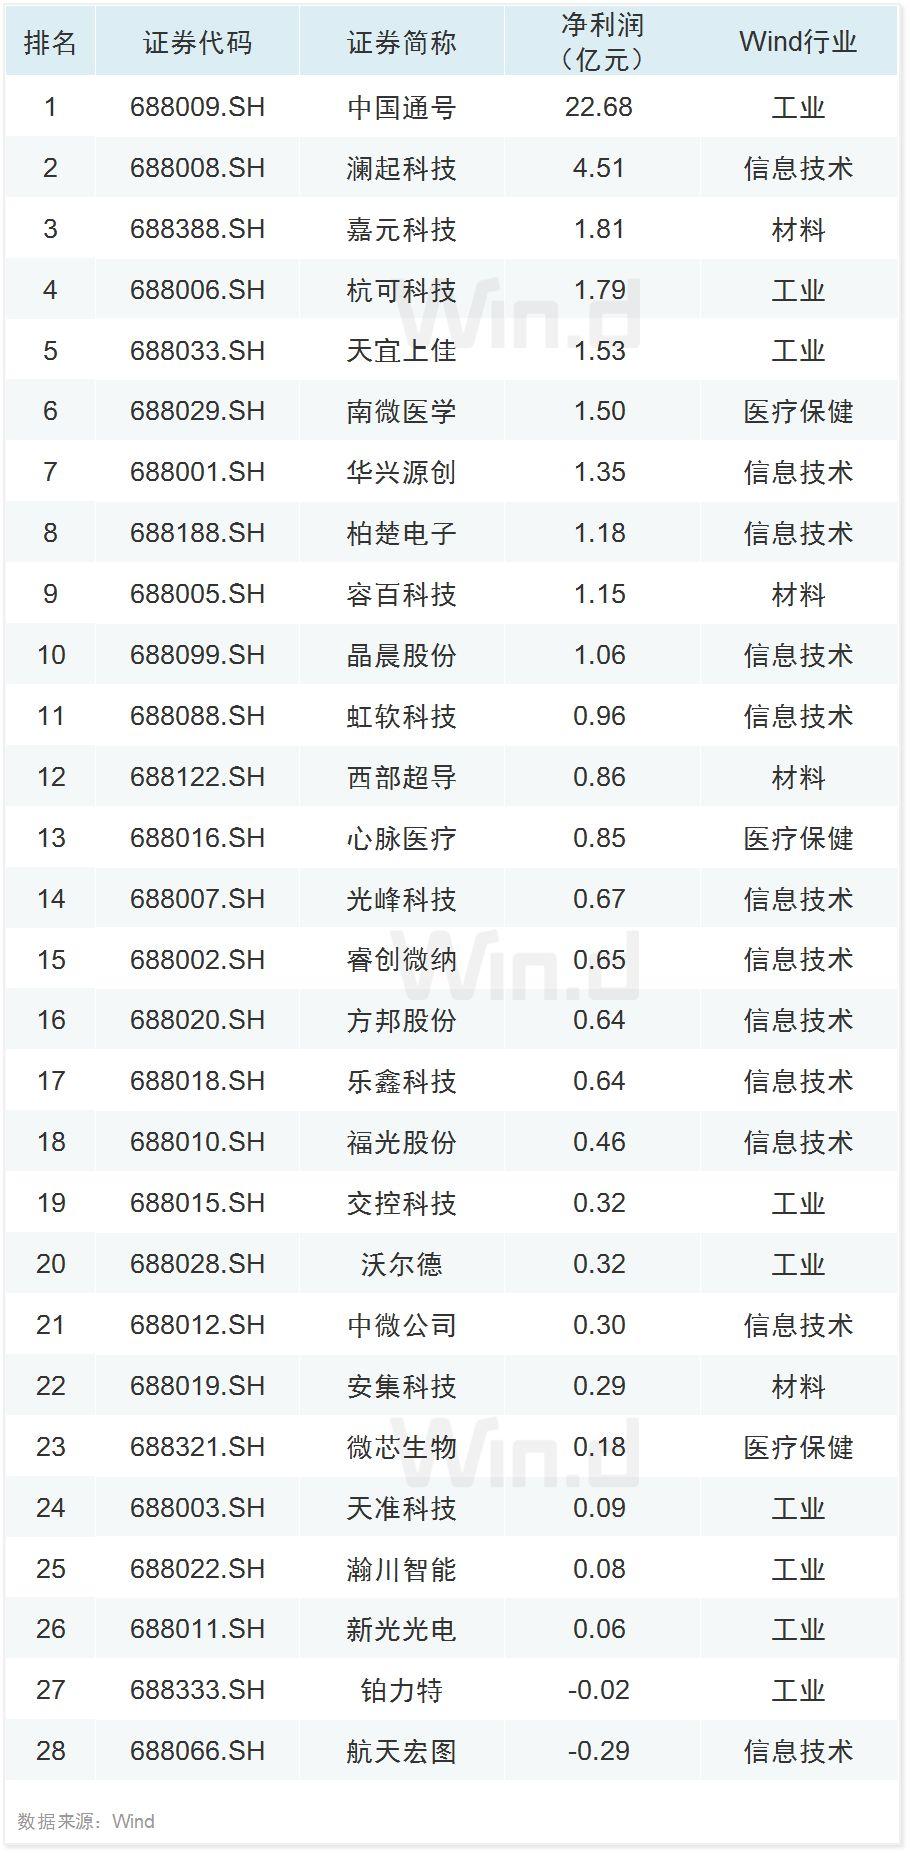
13科创板盈利榜
上半年,科创板公司中,中国通号以22.68亿元的净利润位居第一。
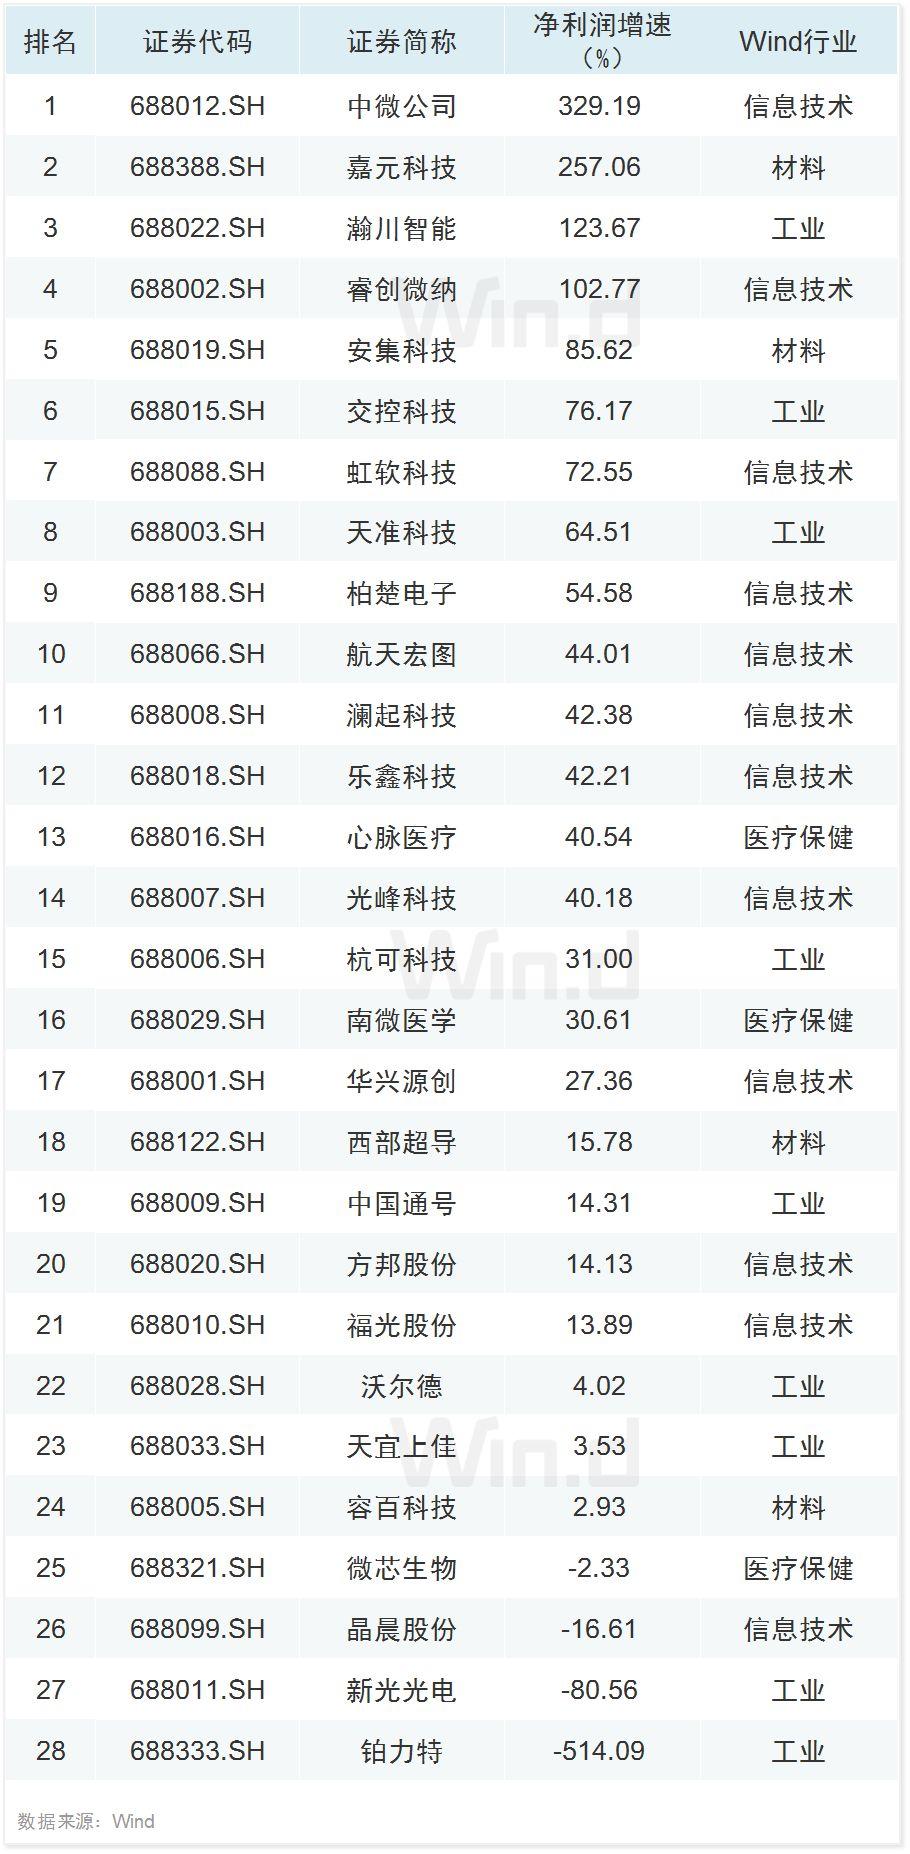
14科创板盈利增速榜
上半年,科创板公司中,中微公司、嘉元科技、瀚川智能、睿创微纳净利润同比均实现翻番位居前四。
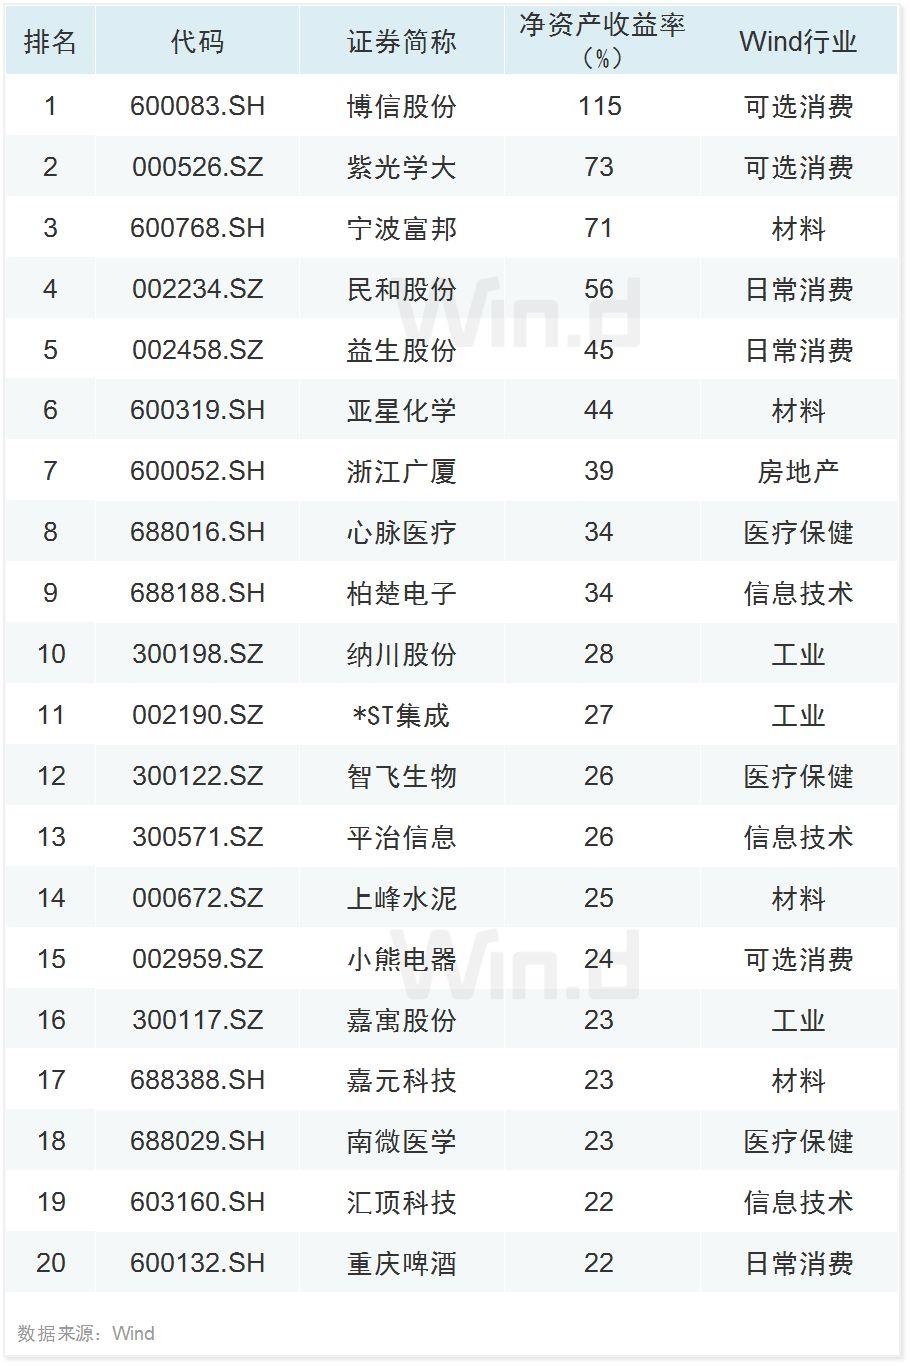
15盈利能力榜TOP20
上半年,博信股份净资产收益率超过100%居首;紫光学大、宁波富邦两家公司均超过70%,紧随其后。
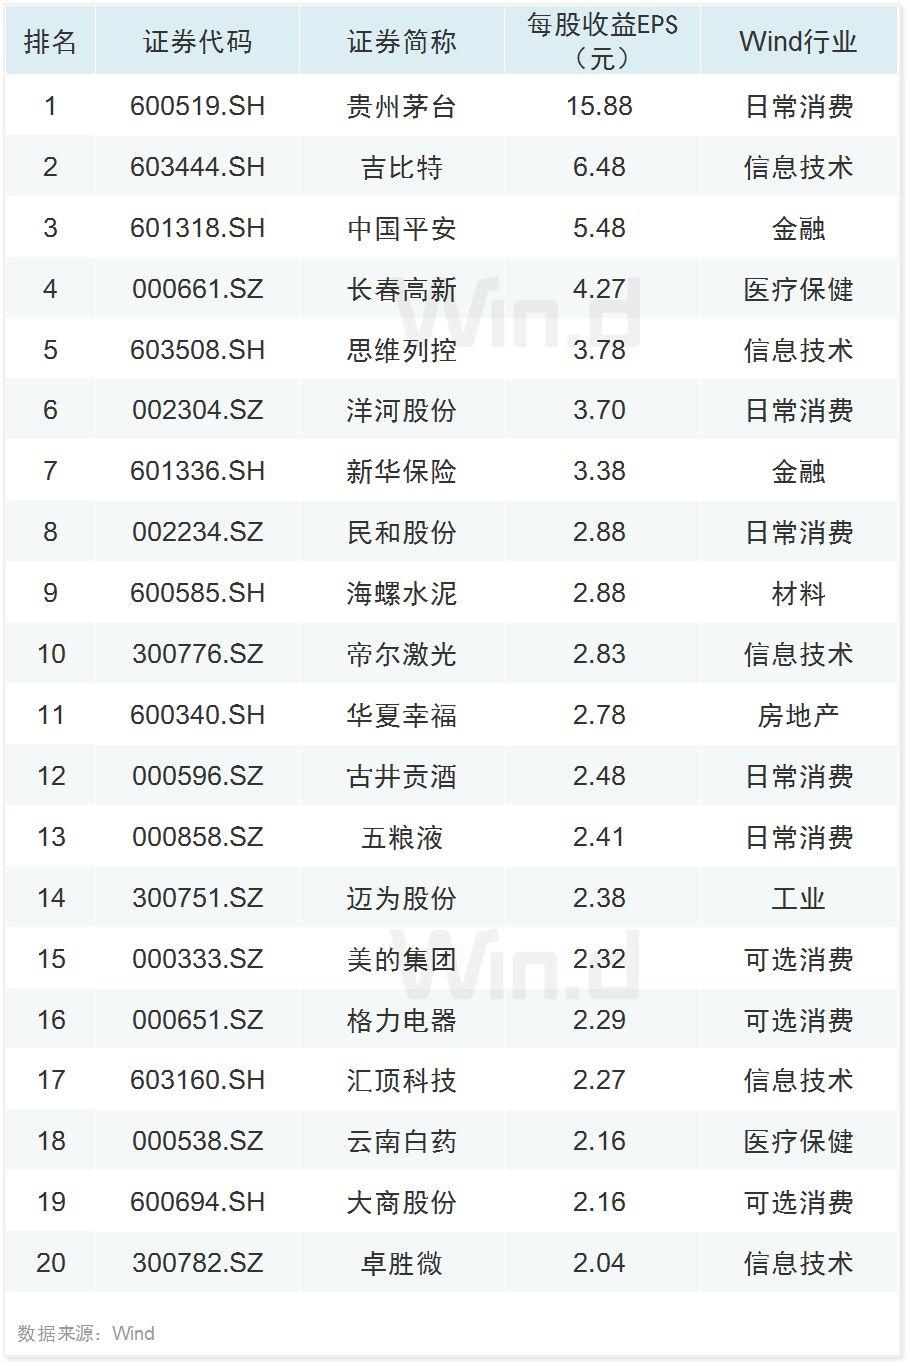
16每股收益榜TOP20
贵州茅台每股收益达15.88元稳居第一。
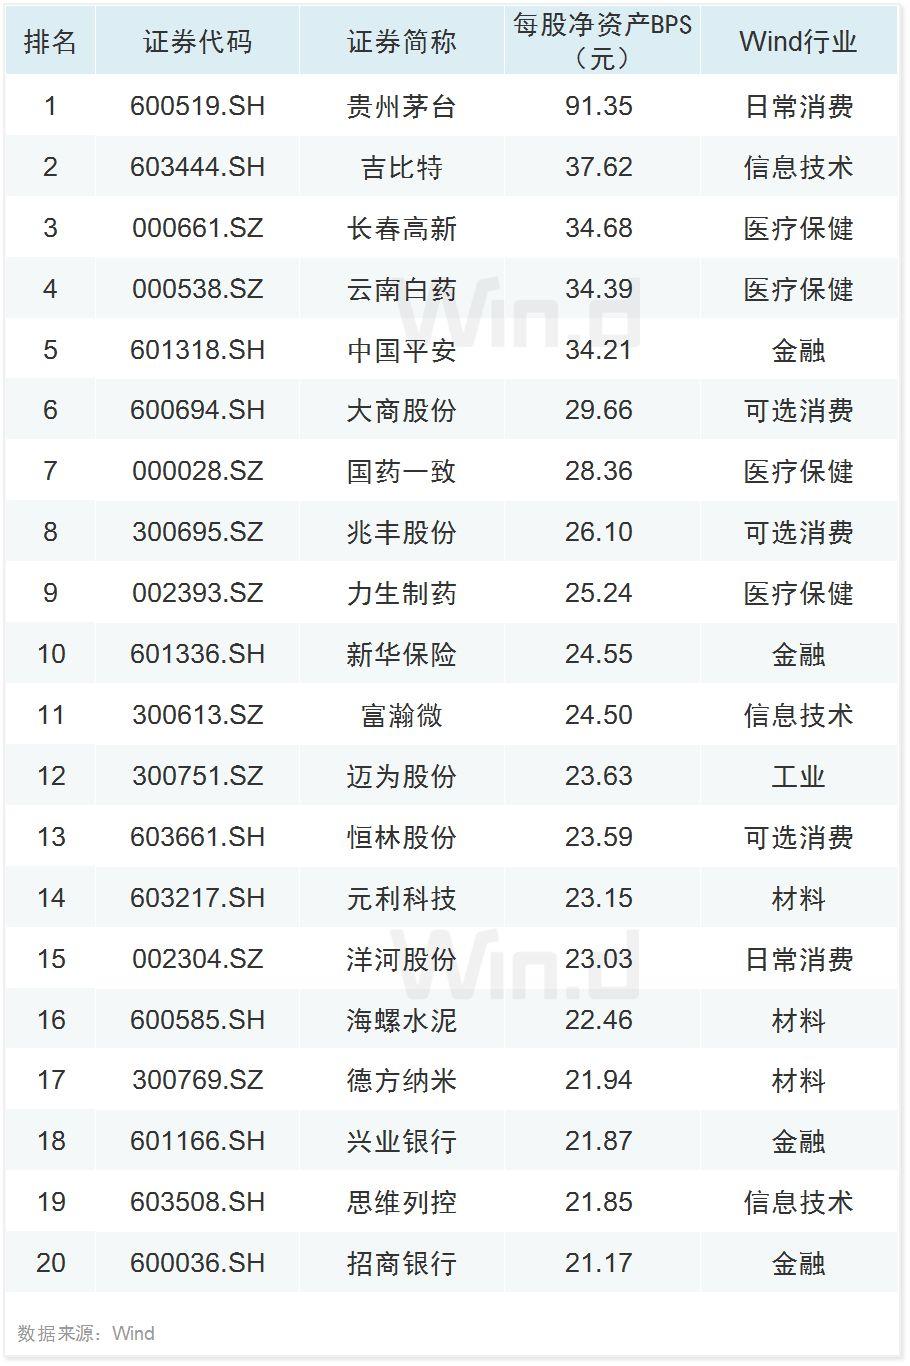
17每股净资产TOP20
每股净资产方面,贵州茅台高达91.35元遥遥领先。
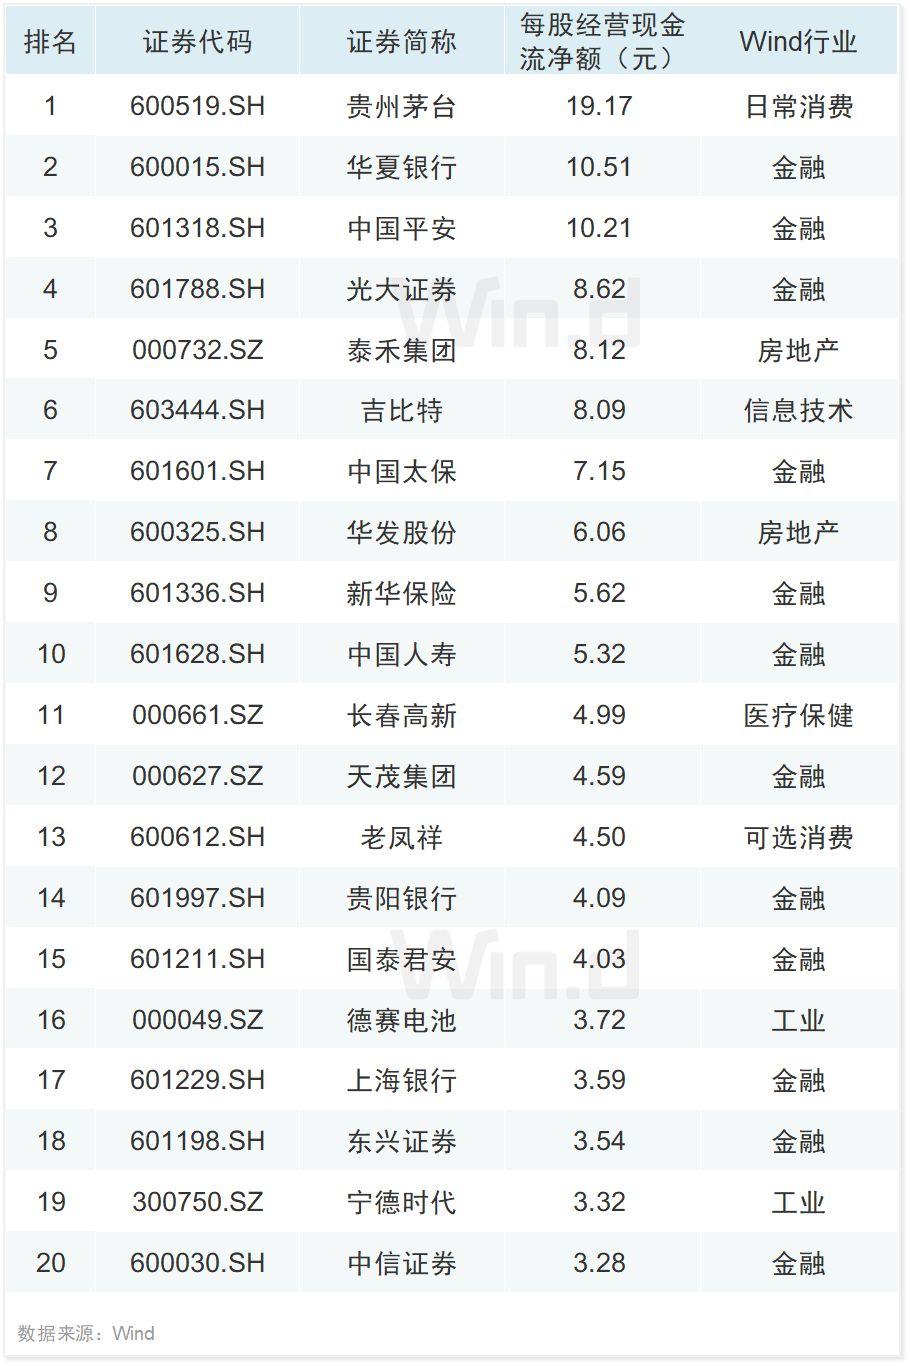
18每股经营现金流TOP20
上半年,贵州茅台、华夏银行、中国平安每股经营性现金流量净额均超过10元居前。
备注:
1、本文所用净利润均指归属于上市公司母公司的净利润。
2、A股整体营收增速算法:(∑成分股.本期营业总收入-∑成分股.上年同期调整后营业总收入)*100/ABS(∑成分股.上年同期调整后营业总收入)。剔除本期或上年同期营业总收入为空的成分股。
3、 板块、行业营收和净利润增速算法同上。


More Content


