数据君带你看港股(8月29日)
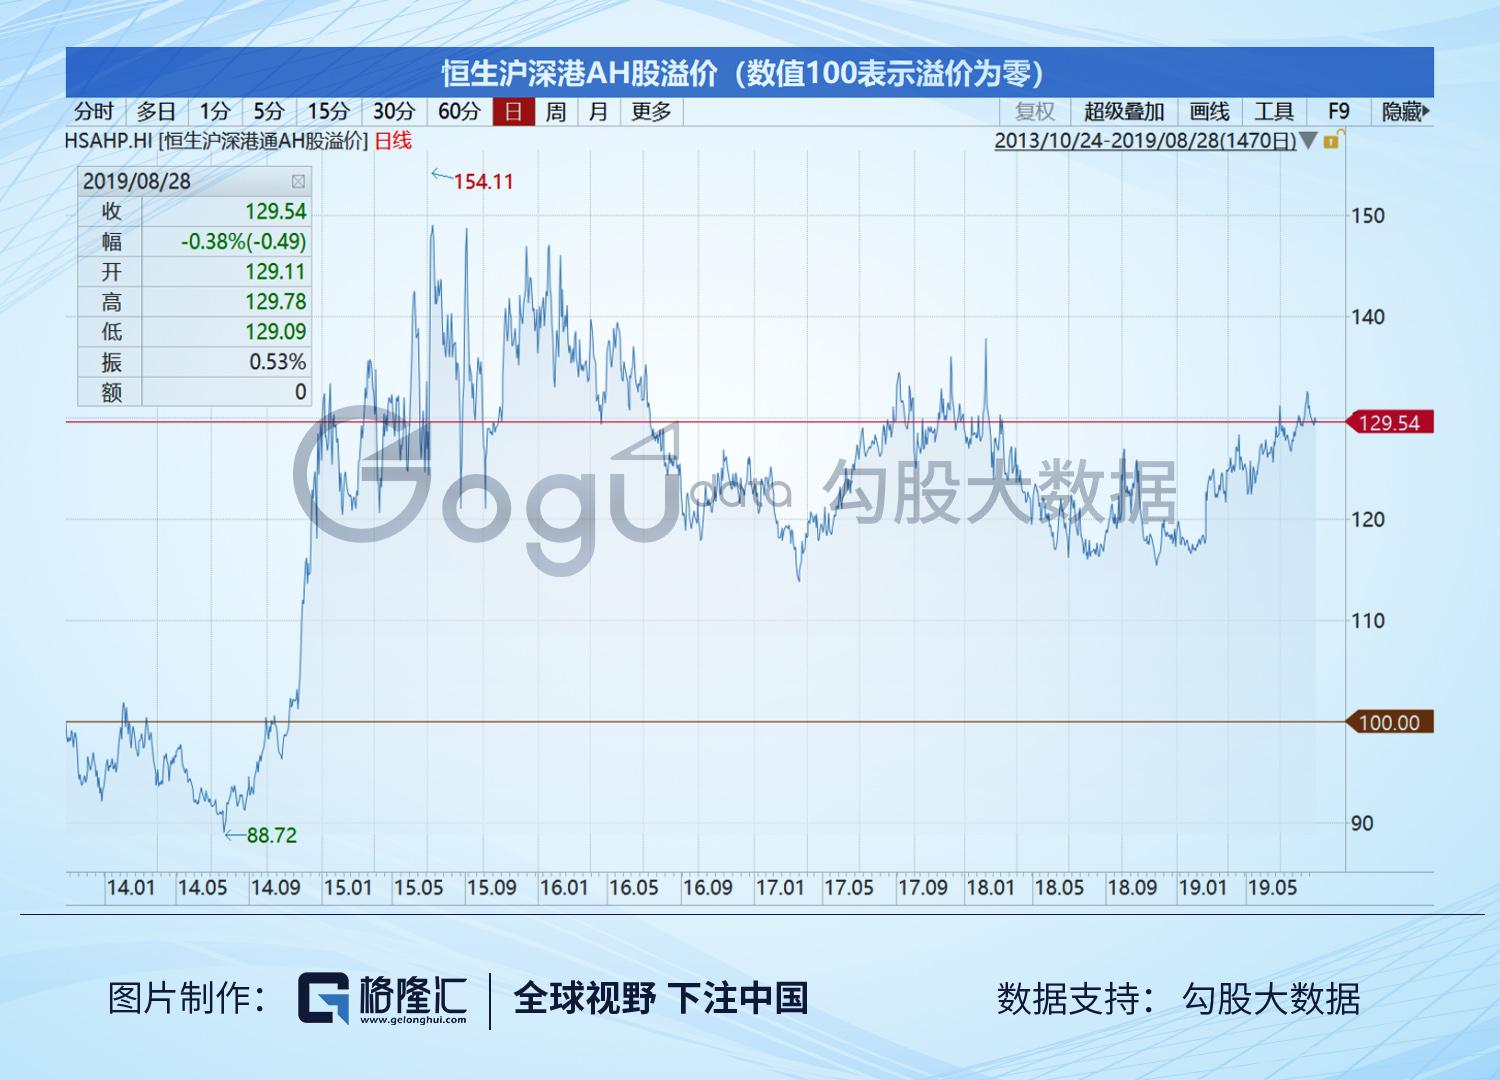
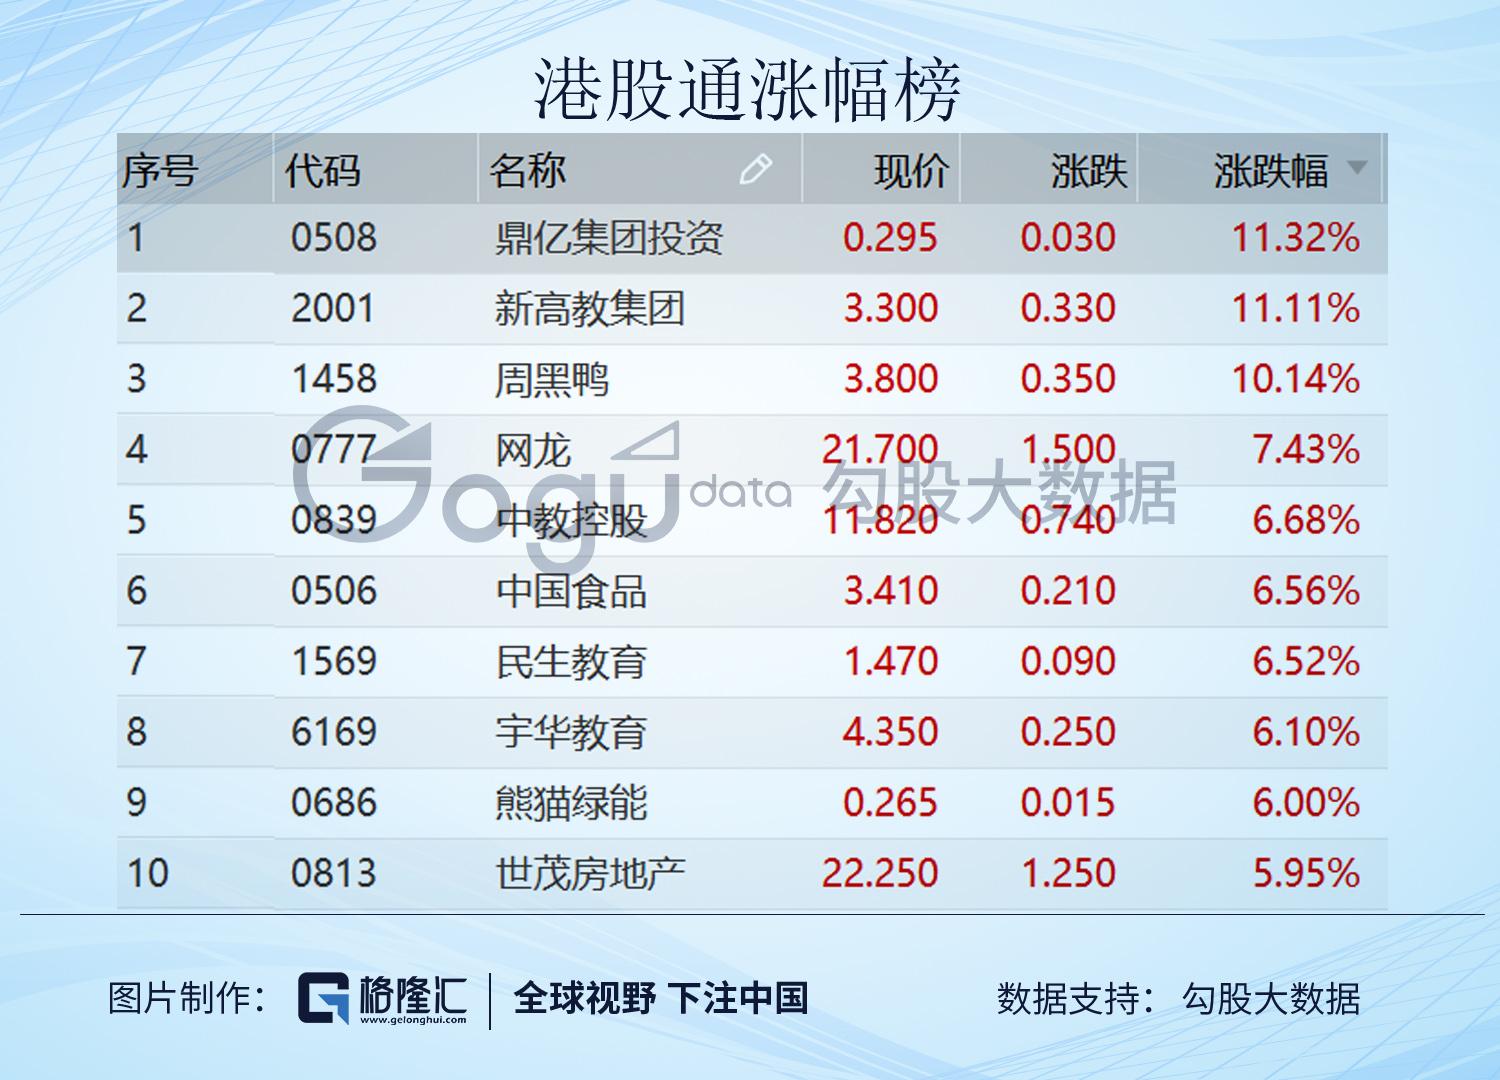
【港股】 昨日港股市场现高开低走行情,主要股指小幅收跌。市场整体情绪略显疲弱,风险偏好持续偏低。市场走势依旧在低位徘徊。上午盘汽车股爆发领涨午盘现回落,教育股午盘接力领涨。截至收盘,恒指跌0.19%,报25615.48点。国指跌0.15%,报9980.73点。主板全日成交747.65亿港元,港股通净流入21.79亿港元。从板块表现看,教育股午盘持续拉升领涨板块,餐饮股全日强势,汽车股、光伏太阳能、燃气股、家电股、蓝筹地产股走强,药品股、手游股跌幅居前,航空股、重型机械、华为、苹果概念、农业股普跌。个股方面,银河娱乐升超2%为最佳恒指成份股;恒安国际、中银香港、港铁公司、恒隆地产涨超1%;腾讯跌2.2%大市承压;石药集团大跌近5%为最差蓝筹股;中生制药亦下跌3.45%;新奥能源升2.35%领涨国指;港股通标的股周黑鸭大涨10%;中国重汽、华晨中国涨近5%;新高教集团大涨逾11%;中教控股、民生教育皆升超6%。
【A股】 三大股指于早盘跌至日内低位后一路回升,创业板率先翻红,深成指紧随其后,沪指跌幅进一步缩窄。进入尾盘段,随着北上资金转为净流入,三大股指再度掉头向下,两市股票下跌数上升,电脑设备、券商、保险、等行业板块跌幅扩大;唯有农林牧渔板块维持强劲,大北农、罗牛山等多股涨停。截止收盘,沪指跌0.29%,2900点得而复失,收报2893.76点;深成指跌0.31%,报9414点;创业板跌0.18%,报1625.19点。两市成交额不足5000亿,北上资金净流出逾4亿。
【美股】 美股周三低开高走,三大基准股指收盘全线上扬,道指上涨258.20点,或1%,报26036.10点;标普500指数上涨18.78点,或0.65%,报2887.94点;纳指上涨29.94点,或0.38%,报7856.88点。标普500指数11个板块中有10个板块上涨。美国能源信息署周三报告称,截至8月23日当周美国原油库存减少1000万桶,为7月19日当周减少1080万桶之后的最大周降幅。此前接受标普全球普氏能源资讯调查的分析师平均预期该数字将减少470万桶。原油库存数据公布后,周三美国WTI原油与伦敦布伦特原油收高。油价上涨带动能源板块普遍上扬。市场仍在关注美债收益率倒挂现象。美债收益率曲线倒挂幅度继续扩大,令一些投资者颇感担忧。2年期美债收益率下跌0.8个基点至1.52%,10年期美债收益率下跌2.1个基点至1.469%,二者之间的利差扩大至近5个基点,创2007年来最大。
数据看市


Follow us
Find us on
Facebook,
Twitter ,
Instagram, and
YouTube or frequent updates on all things investing.Have a financial topic you would like to discuss? Head over to the
uSMART Community to share your thoughts and insights about the market! Click the picture below to download and explore uSMART app!

Disclaimers
uSmart Securities Limited (“uSmart”) is based on its internal research and public third party information in preparation of this article. Although uSmart uses its best endeavours to ensure the content of this article is accurate, uSmart does not guarantee the accuracy, timeliness or completeness of the information of this article and is not responsible for any views/opinions/comments in this article. Opinions, forecasts and estimations reflect uSmart’s assessment as of the date of this article and are subject to change. uSmart has no obligation to notify you or anyone of any such changes. You must make independent analysis and judgment on any matters involved in this article. uSmart and any directors, officers, employees or agents of uSmart will not be liable for any loss or damage suffered by any person in reliance on any representation or omission in the content of this article. The content of the article is for reference only and does not constitute any offer, solicitation, recommendation, opinion or guarantee of any securities, virtual assets, financial products or instruments. Regulatory authorities may restrict the trading of virtual asset-related ETFs to only investors who meet specified requirements. Any calculations or images in the article are for illustrative purposes only.
Investment involves risks and the value and income from securities may rise or fall. Past performance is not indicative of future performance. Please carefully consider your personal risk tolerance, and consult independent professional advice if necessary.


