中国海外发展(0688.HK)业绩稳健增长管理红利或将释放维持“买入”评级
机构:天风证券
评级:买入
事件:公司发布2019年中期业绩公告,2019年上半年实现营业收入港币933.8亿元,同比增长5.4%;实现归母净利润港币249.4亿元,同比增长7.4%。每股基本盈利港币2.28元,同比增长7.4%。
核心净利润增速15.6%,商业地产双轮驱动
2019上半年公司实现营业收入港币933.8亿元,同比增长5.4%;实现归母净利润港币249.4亿元,同比增长7.4%(人民币增速13.4%),核心净利润港币209.9亿元,同比增长9.5%(人民币增速15.6%)。截至2019年6月底,公司(不含中海宏洋)已售未结金额港币2215亿元,较2018年末增长25.6%,对应已售未结面积909万方,较2018年末增长10.3%,已售未结均价2.44万/平米,对未来营收规模及毛利率形成有力支撑。
销售高增长,未结项目丰富支撑营收增长
2019年1-6月,公司实现销售金额港币1942亿元,同比上升28.7%(人民币增速35.1%),较2018H1增速18.5%上升10.3个百分点,完成2019全年销售目标(港币3500亿元)的55.5%。实现销售面积922万方,同比上升8.9%,较2018H1增速8.6%上升0.3个百分点。销售均价2.11万港元/平米,同比增长18.3%,较2018H1增速9.1%上升9.2个百分点,维持高位稳定,溢价能力领先,且公司销售质量较高,销售回款率维持高水平。
拿地量缩价升,聚焦一线核心稀缺地块
审慎扩充优质土储,2019H1公司(不含中海宏洋)累计新增建面464万方,同比降低41.2%,权益建面442.45万方,同比降低33.4%,权益比重回升至95%。按权益地价(港币574.1亿元)来看一线城市和香港占比44.1%,同比提升7.7个百分点,加强聚焦核心一线城市。累计拿地楼面均价为1.3万元/方,同比增长87.5%,主要因为上半年公司在北京和上海核心地段新增优质项目,单价高带动平均拿地单价上涨。我们认为公司拿地聚焦一线城市核心地段,在保证销售回款的基础上有一定概率继续提升毛利率。
杠杆水平稳定,现金流充盈,短债覆盖倍数3.74
2019H1公司资产负债率60.1%,较2018年末略升0.55个百分点,净负债率35%,较2018年末上升1.3个百分点,处于行业低水平。有息负债港币2178.8亿元,较18年末上升11.2%,其中短债港币299.3亿元,较18年末环比下降3.2%,占有息负债比例为13.7%,较18年末下降2个百分点。
公司重点关注现金流,强化资金管控,在手货币资金港币1120.36亿元,较18年末提升11.4%,占总资产比重14.3%,在手现金充裕。现金短债比达到3.74,较18年末上升0.49,现金流状况持续改善。2019H1公司平均融资成本为4.28%,环比18年末略降0.02个百分点,行业中处于相对低位。
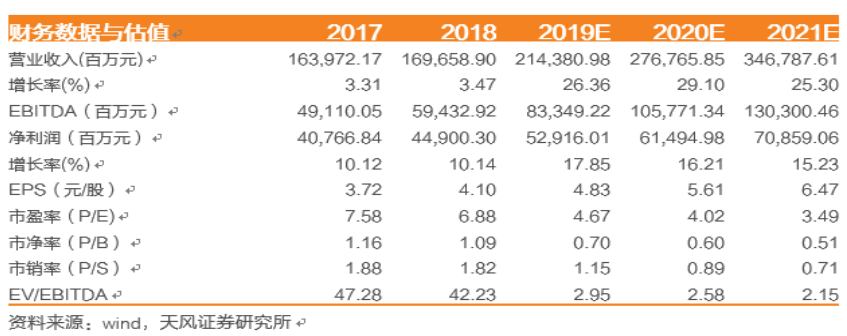
投资建议:公司业绩增速有所提升(受汇率波动影响,人民币增速高于港币),已售未结货值较充裕;新增土储深耕核心一二线,其中44.1%位于一线城市及香港的核心地段,资源价值十分丰厚;公司保持高回款率、高速拿地的同时,控制了负债率和融资成本低位。公司管理层股权激励将于2020年6月步入行权期,公司销售、拿地均有加速,管理红利或释放在即,业绩有望超预期。我们预计公司19-20年归母净利润分别为529亿、615亿,对应EPS为4.83、5.61元,维持2019年目标价位37.68HKD,维持“买入”评级。
风险提示:政策调控力度超预期,商业物业进展不及预期,汇兑损益风险
Follow us
Find us on
Facebook,
Twitter ,
Instagram, and
YouTube or frequent updates on all things investing.Have a financial topic you would like to discuss? Head over to the
uSMART Community to share your thoughts and insights about the market! Click the picture below to download and explore uSMART app!

Disclaimers
uSmart Securities Limited (“uSmart”) is based on its internal research and public third party information in preparation of this article. Although uSmart uses its best endeavours to ensure the content of this article is accurate, uSmart does not guarantee the accuracy, timeliness or completeness of the information of this article and is not responsible for any views/opinions/comments in this article. Opinions, forecasts and estimations reflect uSmart’s assessment as of the date of this article and are subject to change. uSmart has no obligation to notify you or anyone of any such changes. You must make independent analysis and judgment on any matters involved in this article. uSmart and any directors, officers, employees or agents of uSmart will not be liable for any loss or damage suffered by any person in reliance on any representation or omission in the content of this article. The content of the article is for reference only and does not constitute any offer, solicitation, recommendation, opinion or guarantee of any securities, virtual assets, financial products or instruments. Regulatory authorities may restrict the trading of virtual asset-related ETFs to only investors who meet specified requirements. Any calculations or images in the article are for illustrative purposes only.
Investment involves risks and the value and income from securities may rise or fall. Past performance is not indicative of future performance. Please carefully consider your personal risk tolerance, and consult independent professional advice if necessary.


