特步国际(1368.HK)营收增长23%股价却跌4%
8月21日午间,特步国际(1368.HK)公布了半年度业绩。
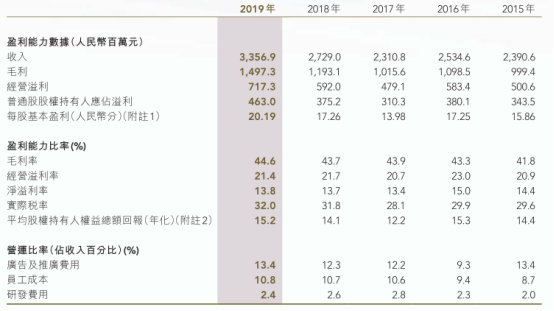
财报显示,上半年营收33.57亿元,同比增23%;毛利率提升0.9%至44.6%;经营溢利7.17亿元,同比增长21%;股东应占溢利4.63亿元,同比增23%;每股基本盈利0.202元;董事会宣派中期股息每股0.125港元,派息比率为59.3%。
发布公告后,特步国际一度在开盘后出现直线拉升走势,拉至涨4%后股价急转直下,随后一路下跌,一度跌超7%,振幅达11.48%。现报5.52港元,跌4%,最新总市值137.7亿港元。

特步国际是一家领先的多品牌体育用品公司,于2008年6月3日在香港联合交易所主板上市。 集团主要从事体育用品(包括鞋履、服装和配饰)的设计、研发、制造、销售、营销及品牌管理。 自2001年成立后,集团的主品牌「特步」拥有超过6,300 间零售店的庞大分销网络,全面覆盖中国31个省份、自治区和直辖市,以及海外地区。 2019年,集团进一步丰富其品牌组合至涵盖四个国际知名品牌,包括盖世威、帕拉丁、索康尼及迈乐。
2019年上半年,在复杂的国际形势和波动的宏观经济下,2019年上半年中国内地经济发展保持稳定。期内,特步中国内地零售额及生产总值分别稳定增长9.8% (4) 及6.3% (4) 。尤其是中国内地的体育用品行业,呈持续增长势头。
特步抓住中国马拉松运动迅速壮大的机遇,积极赞助马拉松赛事,2019年上半年,中国内地参加马拉松及相关体育赛事的参赛者达580万人次,对品牌有重要的促进作用。
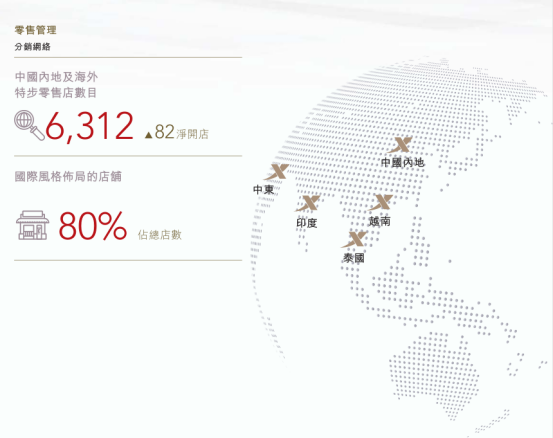
截至6月30日,特步在全球范围内,拥有6312家门店,净开店达到了82家。
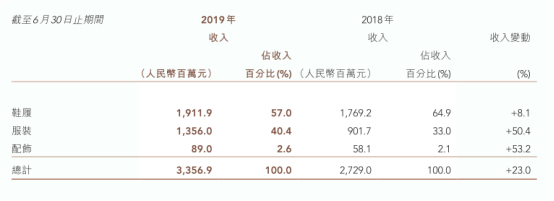
按照产品类别划分,鞋子是主要营收来源,占比达到了64.9%,但是在这一类别的增长平平,来自服装和配饰的收入在大比例上升,分别达到了50.4%和53.2%,表明特步对鞋类产品营收的依赖在下降,但是同样主营的鞋类业务表现平平,也是一个忧虑。
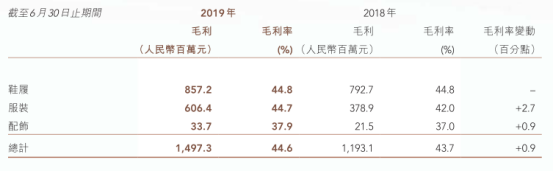
因为从毛利率来看,鞋子正是其最大的毛利率来源,占比达到了44.8%。
值得注意的是,特步在这半年的销售及分销开支约为人民币6.36亿元,相较于2018年的4.8亿增长了32.5%,占集团总收入约19.0%(2018年:17.6%)。
对此,特步方面解释,是由于广告及推广费用增加所致。在报告期内,广告及推广费用约为人民币4.49亿元,占到了集团总收入约13.4%(2018年:12.3%)。

值得一提的是,在对主营的鞋子业务上,特步对每季接到来自总代理商及加盟商的产品订单一贯采用审慎方针。集团持续密切监控存货水平,并凭藉公司几乎覆盖所有零售渠道的全面企业资源规划系统实现高效的零售销售。特步可对企业资源规划系统所反映的数据作出快速反应,调整向零售渠道交付产品。因此,零售存货于期内维持健康水平。
在分销网络上,公司中国内地及海外特步零售店数目为6312间,净开店数82间,约60%的店铺由其直营,特步儿童部门的销售点数量达到650个。
在电子商务和O2O中,于2019年上半年,公司的电子商务业务呈稳定增长,占集团收入的20%以上,于2019年连续第二年蝉联天猫跑鞋类别销量第一。
公司大多数的线上产品是电子商务专供的休闲体育用品,占总线上产品的60%。线上O2O产品的价格与实体店内价格相同,以此来增强品牌和推广的协同效应,从而大幅提高集团及独家总代理商的盈利能力。
而就在近日,小摩发表研究报告称,首予特步国际“增持”评级,以现金流折现率计,目标价6.6港元。
该行指出,特步作为内地第三大本土运动服品牌,受惠于内地马拉松活动日趋普及,过去三年每年增长达26%,预计未来每年增长达10%。特步在马拉松相关市占11%属领先,在整体市占则约5%。行业趋势理想,能支持特步同店销售自2018年起达双位数增长,较2015至2017年的单位数增长加快。
该行表示,特步正凭借旗下四个国际品牌扩大业务,包括Saucony及Merrell,随着设计及门店更新,预计有助建构增长势头。预计在2019至2021年间,特步销售及盈利年均复合增长分别达17%及19%,估值吸引,相当于未来12个月预测市盈率12倍,并提供5%股息率,较同业安踏属健康。
Follow us
Find us on
Facebook,
Twitter ,
Instagram, and
YouTube or frequent updates on all things investing.Have a financial topic you would like to discuss? Head over to the
uSMART Community to share your thoughts and insights about the market! Click the picture below to download and explore uSMART app!

Disclaimers
uSmart Securities Limited (“uSmart”) is based on its internal research and public third party information in preparation of this article. Although uSmart uses its best endeavours to ensure the content of this article is accurate, uSmart does not guarantee the accuracy, timeliness or completeness of the information of this article and is not responsible for any views/opinions/comments in this article. Opinions, forecasts and estimations reflect uSmart’s assessment as of the date of this article and are subject to change. uSmart has no obligation to notify you or anyone of any such changes. You must make independent analysis and judgment on any matters involved in this article. uSmart and any directors, officers, employees or agents of uSmart will not be liable for any loss or damage suffered by any person in reliance on any representation or omission in the content of this article. The content of the article is for reference only and does not constitute any offer, solicitation, recommendation, opinion or guarantee of any securities, virtual assets, financial products or instruments. Regulatory authorities may restrict the trading of virtual asset-related ETFs to only investors who meet specified requirements. Any calculations or images in the article are for illustrative purposes only.
Investment involves risks and the value and income from securities may rise or fall. Past performance is not indicative of future performance. Please carefully consider your personal risk tolerance, and consult independent professional advice if necessary.


