


格隆汇8月20日丨海底捞(06862.HK)公布,2019年中期,实现收入116.95亿元(人民币,下同),同比增长59.27%;公司拥有人应占净利润9.11亿元,同比增长40.92%;基本每股盈利0.17元。
2019年上半年海底捞新开业130家餐厅,全球门店网络从2018年12月31日的466家增至2019年6月30日的593家,其中550家位于中国大陆的116个城市,以及43家位于中国台湾、中国香港及海外,包括新加坡、韩国、日本、美国、加拿大、英国、越南、马来西亚及澳大利亚等地。
海底捞从“顾客满意度”和“员工努力程度”出发,继续优化运营管理,全面提升顾客的就餐体验。截止到2019年6月30日,服务了超过1.09亿人次顾客,平均翻台率为4.8次╱天。截止到2019年6月30日,海底捞已拥有4380万会员。
2019年上半年,海底捞将不同的智慧化元素体现在不同的门店。截止到2019年6月30日,海底捞已经实现3家门店的智慧机械臂推广应用,3家门店的智慧配锅机推广应用,179家门店智慧传菜机器人的推广应用。
2019年上半年,海底捞在中国大陆全市场及不同区域市场持续推出多种新菜品,并开始销售海底捞品牌的奶茶及其他饮品,为顾客提供了更加丰富的产品选择。2019年上半年推出了187种新菜品。
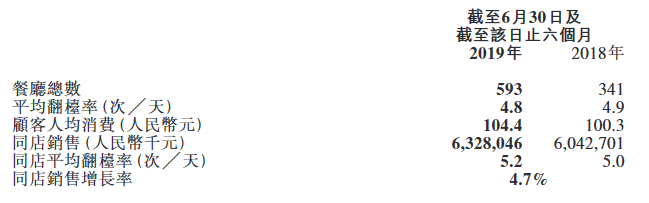
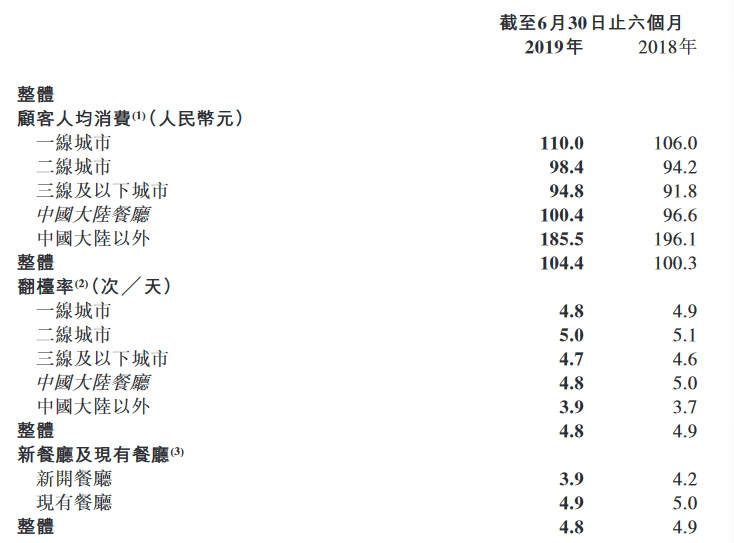
餐厅经营收入是海底捞主要收入来源,截至2019年6月30日止6个月贡献总收入的比例为96.9%,金额从2018年上半年的71.52亿元显着上升到2019年同期的113.31亿元,增长了58.4%,主要由于2018年下半年及2019年上半年新开259间餐厅。同店销售从2018年上半年的60.43亿元上升到2019年同期的63.28亿元,增长了4.7%。顾客人均消费从2018年上半年的100.3元上升到2019年同期的104.4元。
外卖业务收入从2018年上半年的1.33亿元上升到2019年同期的1.88亿元,增长了40.9%,主要由于外卖订单数量增加。
餐厅的若干关键表现指标
附注:
(1)按期内餐厅经营所得总收入除以期内服务顾客总数计算。
(2)按期内服务总桌数除以期内餐厅营业总天数及平均餐桌数计算。
(3)对现有餐厅的定义为,于各期间开始之前已开始运营且于同一期间结束时仍在营业中的餐厅。
同店销售详情
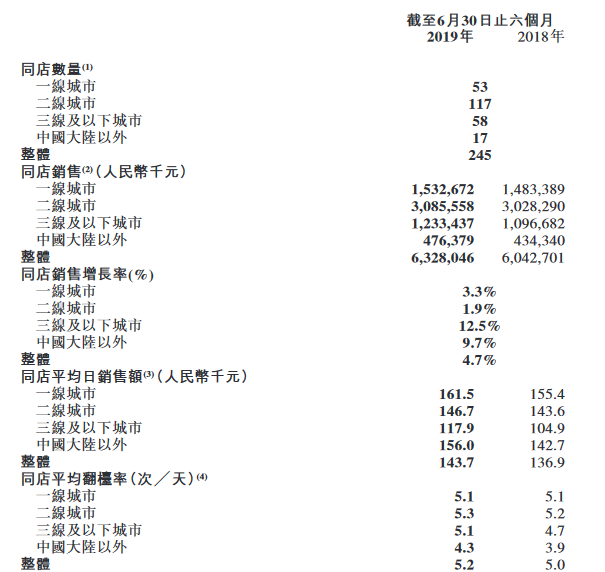
附注:
(1)包括比较期间开始前已开始运营且于截至2018年6月30日止六个月及截至2019年6月30日止六个月营业超过150天的餐厅。
(2)于所示期间我们同店餐厅业务的收入总额。
(3)按期间同店餐厅业务的总收入除以期间同店总营业日数计算。
(4)按期间同店服务总桌数除以期间同店总营业日数及同店平均餐桌数计算。
根据地理区域划分的餐厅经营收入
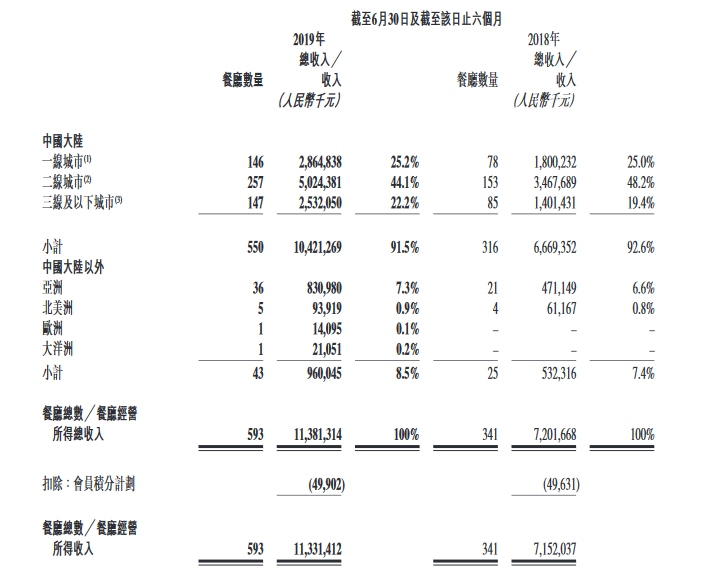
附注:
(1)北京、上海、广州和深圳。
(2)除一线城市外,所有直辖市和省会城市,外加青岛、厦门、宁波、大连、珠海、苏州和无锡。
(3)所有除去一、二线外的城市及地区。
原材料及易耗品成本
原材料及易耗品成本从截至2018年6月30日止6个月的30.66亿元上升到2019年同期的49.03亿元,增长了59.9%,主要由于业务扩张。就所占收入百分比,原材料及易耗品成本保持相对稳定,截至2018年6月30日止6个月和截至2019年6月30日止6个月分别为41.8%和41.9%。
员工成本
员工成本从截至2018年6月30日止6个月的22.03亿元上升到2019年同期的36.52亿元,增长了65.8%,就所占收入百分比,从截至2018年6月30日止6个月的30.0%增长到2019年同期的31.2%,主要由于业务的扩张和员工薪资水平的提高。
物业租金及相关开支
物业租金及相关开支从截至2018年6月30日止6个月的2.72亿元下降到2019年同期的9610万元,下降了64.7%,就所占收入百分比,从截至2018年6月30日止6个月的3.7%下降到2019年同期的0.8%,主要由于首次应用国际财务报告准则第16号,适用国际财务报告准则第16号的租赁合同相关的租金开支录于折旧及摊销项下。
折旧及摊销
折旧及摊销从截至2018年6月30日止6个月的2.94亿元上升到2019年同期的8.30亿元,增长了182.8%,就所占收入百分比,折旧及摊销从截至2018年6月30日止6个月的4.0%上升到2019年同期的7.1%,主要由于首次应用国际财务报告准则第16号会计准则导致公司的使用权资产折旧增加,物业租金及相关开支减少;以及公司业务扩张的影响。
水电开支
水电开支从截至2018年6月30日止6个月的2.55亿元上升到2019年同期的4.39亿元,增长了72.5%,主要由于公司业务的扩张。就所占收入百分比,水电开支保持相对稳定,截至2018年6月30日止6个月和截至2019年6月30日止6个月分别为3.5%和3.8%。
其他开支
其他开支从截至2018年6月30日止6个月的3.01亿元上升到2019年同期的4.62亿元,增长了53.2%,是由于公司业务的扩张。就所占收入百分比,其他开支从截至2018年6月30日止6个月的4.1%略有下降至2019年同期的3.9%。


More Content


