银城控股(01902.HK)营收增33倍利润降8成销售费用大增利润承压
作者:新浪财经
来源: 新浪财经
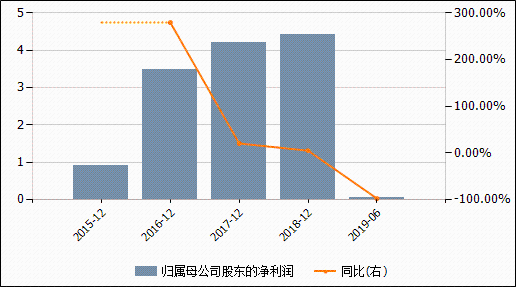
8月19日,银城国际控股发布公司港股上市以来的首份半年报,上半年公司实现营收37.39亿元,同比大幅增长33.43倍,与此同时公司净利润仅为4850万元,同比大幅下降80.1%。
银城国际营收与净利润之间的巨大差别引人关注,公司营收达到37.39亿元,同比增长33.43亿元,主要是来自于物业销售的确认收益,达到37.37亿元。
但其他收入同比大幅减少,由3.18亿元下降至0.73亿元,这其中主要为分阶段达到业务合并所得的投资收入,为阶段性的收入,全部集中在2018年上半年。今年的结算及利润相对来说更为复合公司的正常水平,销售毛利率仅为12.03%,净利润率更是低至1.29%,为近五年来最低。
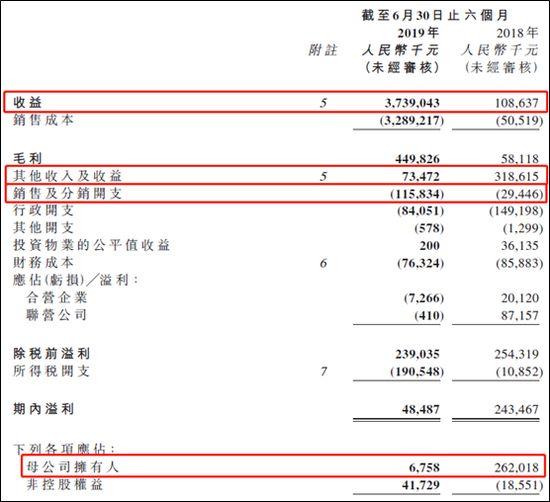
值得注意的是,在公司其他收入下降的同时,销售及分销开支却由去年全年的0.29亿元,大幅增加至今年上半年的1.16亿元,增长近3倍之多,这或和公司上半年较为靓丽的销售业绩有关,不过如此高的销售费用对于公司10%左右的净利润率来说将会形成不小的影响。
银城国际净利润下降超8成,其中归属于上市公司股东的净利润的下降幅度更是达到97.42%,仅为675.8万元,与此同时,归属于少数股东的利润却大幅增长,由去年同期的亏损1855万元,增长至今年的盈利4173万元。也就是说,今年公司结算的营收中,多数来自于合营项目,且公司的权益占比不高。
2018年年底,银城国际短期借款由上年的13.42亿元猛增至53亿元,而账面货币资金仅15.89亿元,即使加上受限制现金1.23亿元,也仅17亿出头,短期偿债压力巨大。长期借款48.91亿元,短长占比结构也不尽合理。公司的净负债率高达高达350%,即使在上市融资后该指标也高达250%。
银城国际上半年实现销售78.99亿元,同比增长258.4%,净负债率由351.5%下降至149%。净负债率下降,短期偿债压力得到缓解的背后是公司加大销售回款的力度,而失控的销售费用则令银城国际的净利润率承压。
Follow us
Find us on
Facebook,
Twitter ,
Instagram, and
YouTube or frequent updates on all things investing.Have a financial topic you would like to discuss? Head over to the
uSMART Community to share your thoughts and insights about the market! Click the picture below to download and explore uSMART app!

Disclaimers
uSmart Securities Limited (“uSmart”) is based on its internal research and public third party information in preparation of this article. Although uSmart uses its best endeavours to ensure the content of this article is accurate, uSmart does not guarantee the accuracy, timeliness or completeness of the information of this article and is not responsible for any views/opinions/comments in this article. Opinions, forecasts and estimations reflect uSmart’s assessment as of the date of this article and are subject to change. uSmart has no obligation to notify you or anyone of any such changes. You must make independent analysis and judgment on any matters involved in this article. uSmart and any directors, officers, employees or agents of uSmart will not be liable for any loss or damage suffered by any person in reliance on any representation or omission in the content of this article. The content of the article is for reference only and does not constitute any offer, solicitation, recommendation, opinion or guarantee of any securities, virtual assets, financial products or instruments. Regulatory authorities may restrict the trading of virtual asset-related ETFs to only investors who meet specified requirements. Any calculations or images in the article are for illustrative purposes only.
Investment involves risks and the value and income from securities may rise or fall. Past performance is not indicative of future performance. Please carefully consider your personal risk tolerance, and consult independent professional advice if necessary.


