李宁(2331.HK)内外生因素共同催化近年来最高增速维持“增持”评级
机构:中泰证券
评级:持有
投资要点
事件:
截至2019年6月30日,公司营收增速达到33%至62.55亿人民币,毛利率提高1个百分点至49.7%,净利率由去年同期的5.7%提高至12.7%,归母净利润提高196%至7.95亿元,扣除一次性与经营无关的归母净利润为5.61亿元,增速达到109%。此外,公司资金运营情况持续改善,经营性现金流同比增加107%至13.66亿元,现金及其等价物同比增长28.7%至47.25亿元,现金循环周期同比缩短13天至32天。
点评:
收入增速:2019年上半年公司实现了近十年来的最高增速,营收同比增速达到33%,我们认为公司的高增速主要来自于门店数量的拓展及门店经营效率的提高。门店数量:截至2019年6月30日,李宁门店总数达到7294个,较2018年12月31日净增加157个,其中特许经销门店净增加205个,直营门店净减少127个(部分直营门店转接经销商;关小店开大店),李宁Young净增加79个;同店增速:期内整个平台(不包括李宁Yong)取得10%-20%的中段同店增长,其中直营及渠道均获得10-20%的低段同店增长,电商渠道获得30-40%的中段同店增长;渠道收入:经销门店收入增长45.3%至30.4亿元,直营门店收入增长12.3%至17.6亿元,电商渠道收入增长38.5%至13.6亿元。
盈利能力:2019年上半年公司归母净利润增速达到196%,除了受益于营收的高增长,以及大额一次性非经营性利润外(联营公司土地被政府收购收益达2.7亿元),还得益于公司有效的成本控制及不断提高的经营效率,期内公司周转天数下降11天至74天,贸易应收款周转天数下降18天至24天。毛利率:一方面,公司增开高效大型店铺,关闭低效店铺措施的执行,终端数据反馈及时,门店店效持续提高;另一方面,经销商发货折扣提高,自营渠道销售折扣收窄,公司毛利率较去年同期提高了1个百分点。净利率:公司归母净利率(扣除与经营无关的一次性收益)同比上升了2.73个百分点至7.74%,主要是由于期内公司积极控制广告及市场推广开支,并且部分直营门店转经销门店降低了销售成本,期内经销费用占比同比降低了4.5个百分点至32.3%。
未来发展:公司将持续推进“单品牌、多品类、多渠道”策略,以不断推动经营效率及经营规模的持续提升。产品方面,公司将不断满足消费者的功能性及时尚性需求(研发费用率2.1%VS去年同期1.3%),提高品牌影响力;渠道方面,公司推进高效大店策略,关闭低效店铺,优化渠道结构;终端运营方面,公司推进店铺运营标准化、智能化,实行区域差异化的商品规划以满足区域性特点及消费需求;从而推动运营效率的提升;总之,随着低效门店关闭,直营高效门店的增加、产品结构优化、供应链效率提升,公司的盈利能力将持续提高;随着门店拓展、各渠道深耕带来同店增速的提高以及公司童装、运动时装和女性运动服饰板块的快速发展,公司的营收规模拓展可持续。
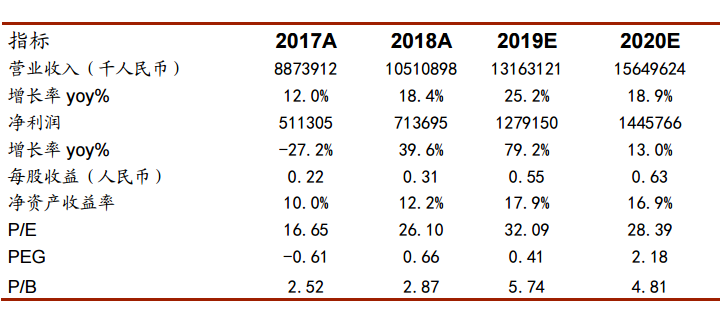
盈利预测与估值与建议:我们预计公司 2019/2020年公司营收为别为131.6亿及156.5亿人民币,同比增速分别为25.2%和18.9%;预计公司2019/2020年的净利润为别为12.8亿及14.5亿人民币,同比增速分别为79.2%和13%,对应2019/2020年的EPS分别为0.55元及0.63元。考虑到公司规模增长的可持续、盈利能力潜在的提升空间及在内资品牌中领先的品牌影响力,我们给予李宁19年33倍PE,对应市值469亿港币,维持“增持”评级。
风险提示。渠道扩展及门店扩张不及预期,导致主品牌销售增速放缓;库存消化不及预期,货品积压,计提减值或老品打折销售,影响业绩表现;宏观经济增速放缓,可选消费品消费受到冲击;公司大力发展的童装及运动时尚品类销售不及预期。
Follow us
Find us on
Facebook,
Twitter ,
Instagram, and
YouTube or frequent updates on all things investing.Have a financial topic you would like to discuss? Head over to the
uSMART Community to share your thoughts and insights about the market! Click the picture below to download and explore uSMART app!

Disclaimers
uSmart Securities Limited (“uSmart”) is based on its internal research and public third party information in preparation of this article. Although uSmart uses its best endeavours to ensure the content of this article is accurate, uSmart does not guarantee the accuracy, timeliness or completeness of the information of this article and is not responsible for any views/opinions/comments in this article. Opinions, forecasts and estimations reflect uSmart’s assessment as of the date of this article and are subject to change. uSmart has no obligation to notify you or anyone of any such changes. You must make independent analysis and judgment on any matters involved in this article. uSmart and any directors, officers, employees or agents of uSmart will not be liable for any loss or damage suffered by any person in reliance on any representation or omission in the content of this article. The content of the article is for reference only and does not constitute any offer, solicitation, recommendation, opinion or guarantee of any securities, virtual assets, financial products or instruments. Regulatory authorities may restrict the trading of virtual asset-related ETFs to only investors who meet specified requirements. Any calculations or images in the article are for illustrative purposes only.
Investment involves risks and the value and income from securities may rise or fall. Past performance is not indicative of future performance. Please carefully consider your personal risk tolerance, and consult independent professional advice if necessary.


