2019年中报点评|丘钛科技(1478.HK)大客户拉货动能充足驱动业绩反转兑现且幅度超预期维持“买入”评级
机构:光大证券
评级:买入
目标价:9.3港币
◆1H19营收增速超预期,盈利如期改善
1H19营收50.6亿元人民币,同比大幅增长58%,较彭博一致预期的49.6亿高约2%,主要由于CCM出货量大幅增长及FRM产品结构改善。毛利率同比上升7个百分点至8.2%,主要由于摄像模组产能利用率提升、指纹模组产品结构明显改善以及生产自动化升级改造渐见成效。受主营业务毛利率大幅增长及联营公司盈利影响,归母净利润为1.81亿元,净利率由1H18的-1.6%上升至3.6%。
◆大客户拉货动能充足,驱动CCM业务高速成长
1H19 CCM营收同比大幅上升52%,主要得益于出货量增长强劲同比上升78%,10MP及以上出货占比由1H18/2H18的39.7%/45.9%提高至46.8%。ASP维持下跌态势,同比下跌14.5%,主要由于多摄分拆供应方案渗透导致公司多摄出货占比偏低;环比继续下跌6.4%,主要由于多摄出货占比继续下降,以及10MP及以上出货占比环比提升幅度有限、3D结构光项目上量不及预期。2019年CCM出货量将延续高速增长,公司上调指引同比增速不低于50%;伴随核心客户中高端项目上量、像素升级及三摄渗透率提升,公司产品结构升级确定性不变,公司维持全年10MP及以上出货占比不低于50%指引,但考虑多摄拆分趋势持续导致公司多摄出货占比提升难度加大,ASP下行压力仍存。综合出货及ASP表现,我们预计19年摄像模组业务营收同比增速有望达50%;叠加产能爬坡、自动化导入效应显现,19年全年盈利改善趋势明确。
◆屏下指纹出货占比扩大,驱动FRMASP大幅提升带来业绩释放
1H19指纹模组业务营收同比大幅上升81%,其中出货量同比下跌17%,ASP同比/环比大幅上升117%/53%,主要得益于产品结构优化明显,高ASP屏下指纹出货占比由2H18的20%大幅上升至51%。19年伴随屏下指纹市场渗透率提升明显以及主动调整,全年产品结构优化有保障(公司指引屏下指纹出货占比不低于40%)。公司FRM业务以产品结构调整为主,我们预计全年出货量同比基本持平;鉴于屏下指纹出货占比上升且价格下降趋势相对缓和,我们预计19年FRMASP有望大幅上升,驱动FRM全年营收同比增长47%。
◆估值与评级
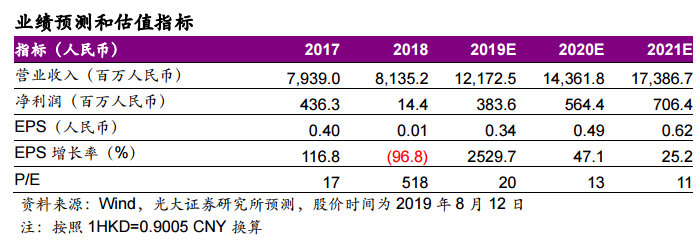
鉴于公司技术及产业链配套能力逐渐比肩一线阵营,产品结构优化有望驱动19年业绩超预期且20年增速继续高于同业,上调19-21年EPS预测6%/9%/15%至0.34/0.49/0.62元人民币,维持目标价9.3港币(对应19/20年25/14倍PE),维持“买入”评级。
◆风险提示:摄像模组行业竞争加剧;产品结构升级不及预期。
Follow us
Find us on
Facebook,
Twitter ,
Instagram, and
YouTube or frequent updates on all things investing.Have a financial topic you would like to discuss? Head over to the
uSMART Community to share your thoughts and insights about the market! Click the picture below to download and explore uSMART app!

Disclaimers
uSmart Securities Limited (“uSmart”) is based on its internal research and public third party information in preparation of this article. Although uSmart uses its best endeavours to ensure the content of this article is accurate, uSmart does not guarantee the accuracy, timeliness or completeness of the information of this article and is not responsible for any views/opinions/comments in this article. Opinions, forecasts and estimations reflect uSmart’s assessment as of the date of this article and are subject to change. uSmart has no obligation to notify you or anyone of any such changes. You must make independent analysis and judgment on any matters involved in this article. uSmart and any directors, officers, employees or agents of uSmart will not be liable for any loss or damage suffered by any person in reliance on any representation or omission in the content of this article. The content of the article is for reference only and does not constitute any offer, solicitation, recommendation, opinion or guarantee of any securities, virtual assets, financial products or instruments. Regulatory authorities may restrict the trading of virtual asset-related ETFs to only investors who meet specified requirements. Any calculations or images in the article are for illustrative purposes only.
Investment involves risks and the value and income from securities may rise or fall. Past performance is not indicative of future performance. Please carefully consider your personal risk tolerance, and consult independent professional advice if necessary.


