中国医美图鉴北京爱抽脂深圳爱植发重庆爱削脸
作者:经纬主页君
来源:经纬创投
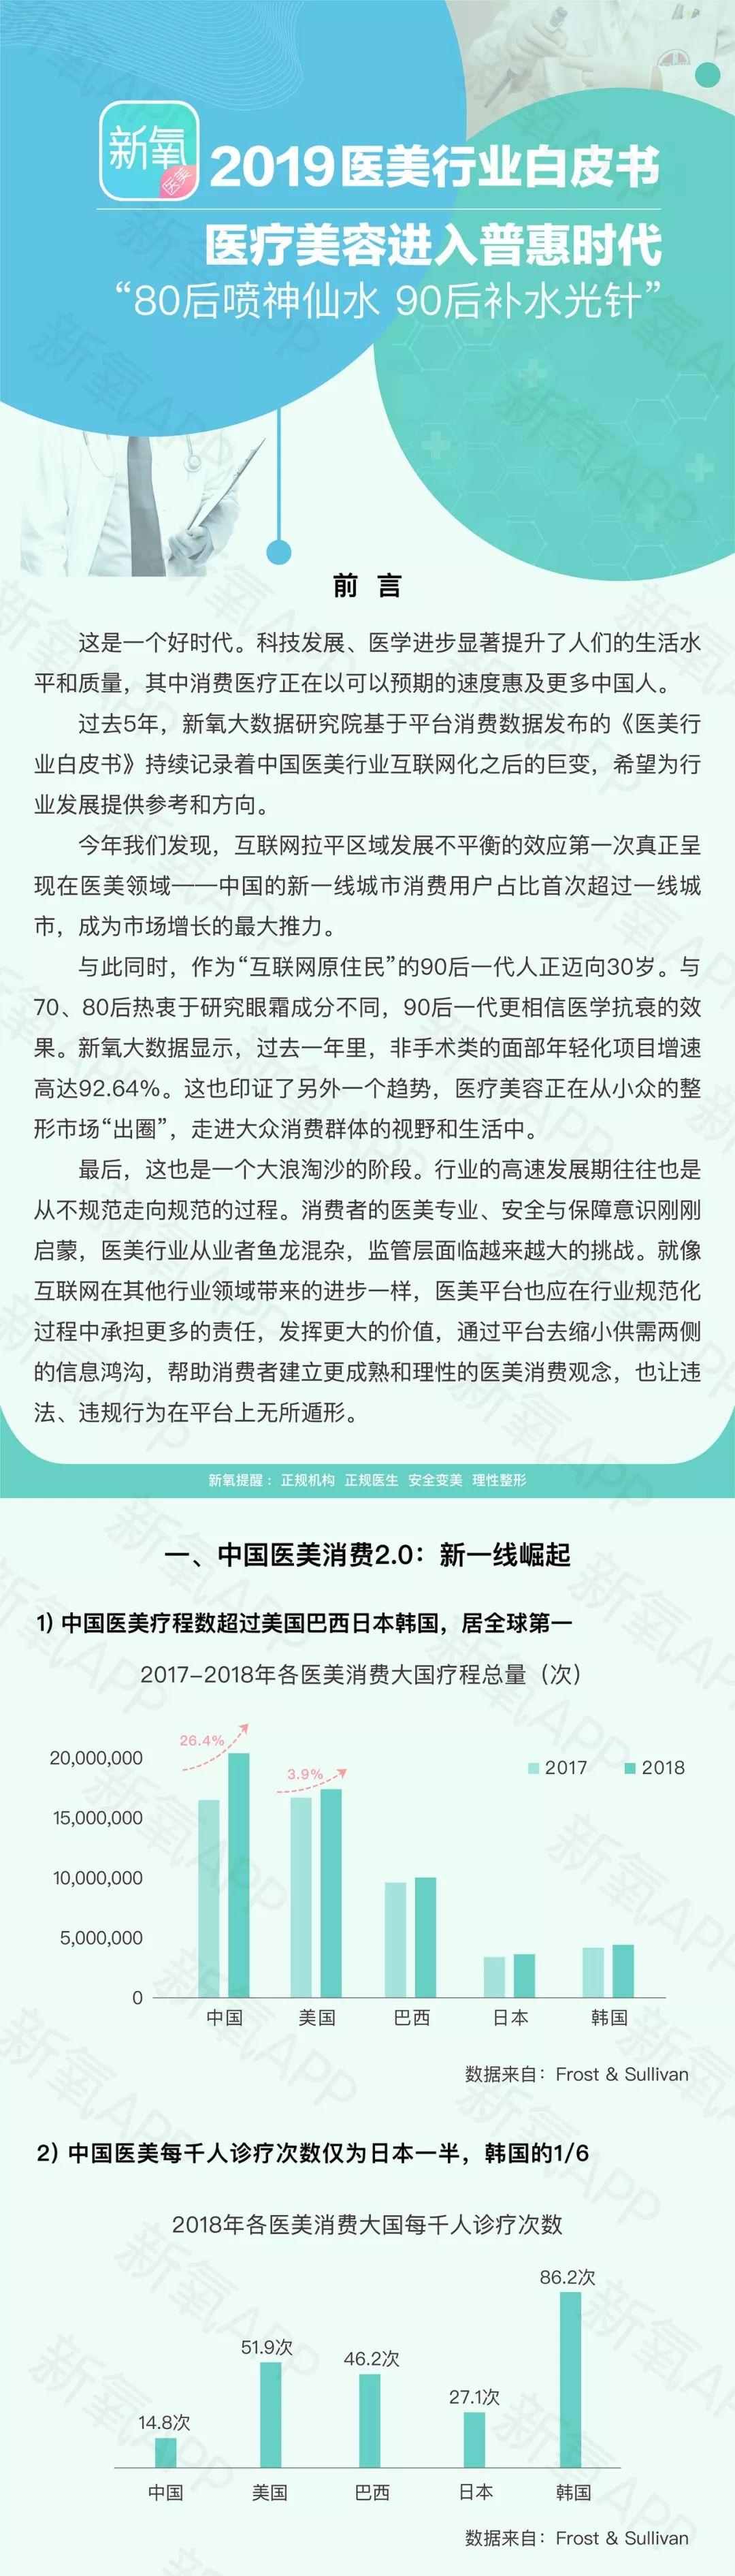
2019年4月,Frost & Sullivan调查显示,2017年中国医美疗程消费类为1629万,仅次于美国的1634万,且中国年增速26.4%,远超美国的3.9%。以此推算,2019年中国医美疗程消费量将超过美国巴西日本韩国这些医美消费大国,居全球第一。
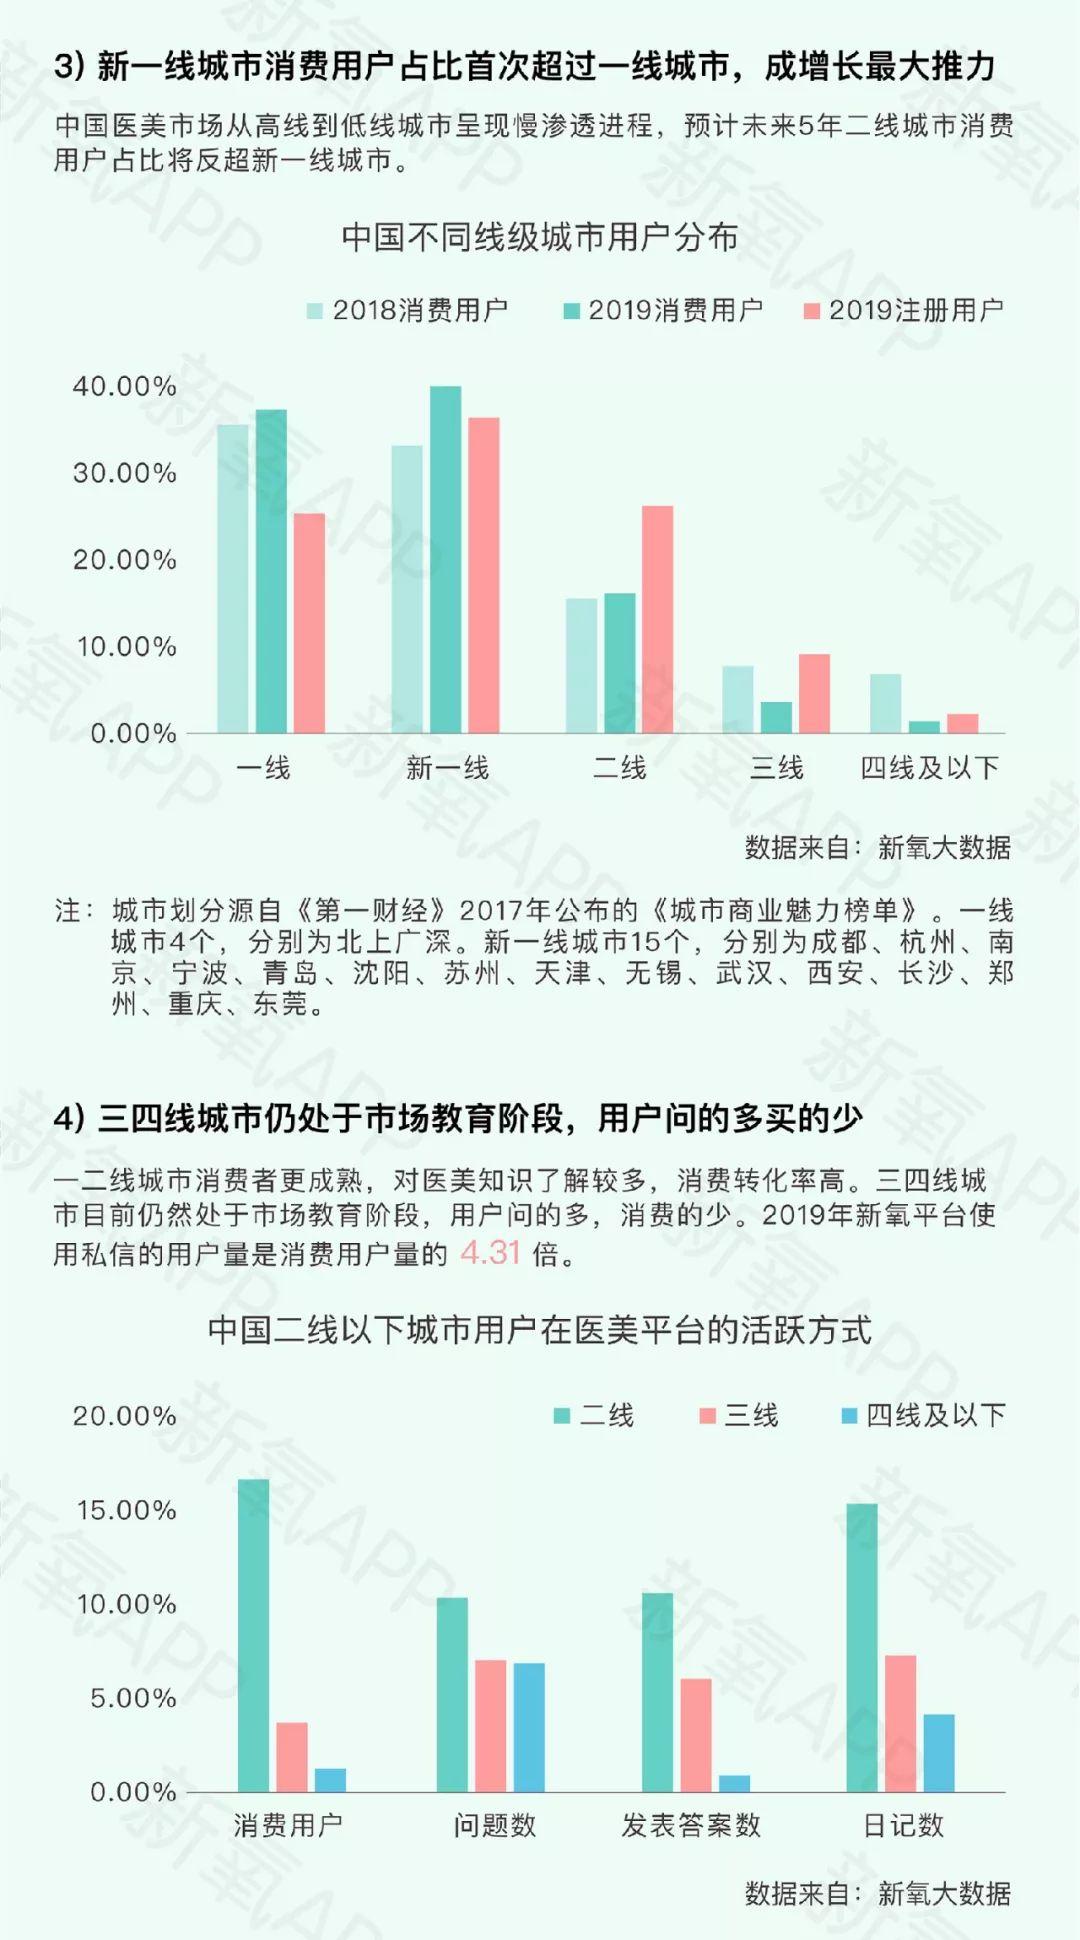
中国医美市场的增长主要源自渗透率的提升,包括新一代消费群体的进入、市场下沉以及医学抗衰将成为大众消费。其中,值得注意的是,中国新一线城市消费用户占比首次超过一线城市,成为市场增长的最大推力。
今天我们分享的这份《2019年医美行业白皮书》由新氧App制作,数据来自自新氧平台的用户和消费行为数据、社区用户调研、以及医美机构、上游厂商的实地走访调查,集中展示了中国医美行业的发展现状与最新亮点。
其中也有一些有颇有意思的现象:
从全国的医美审美取向上看,中国人整体“爱面子”、“爱纤细”。
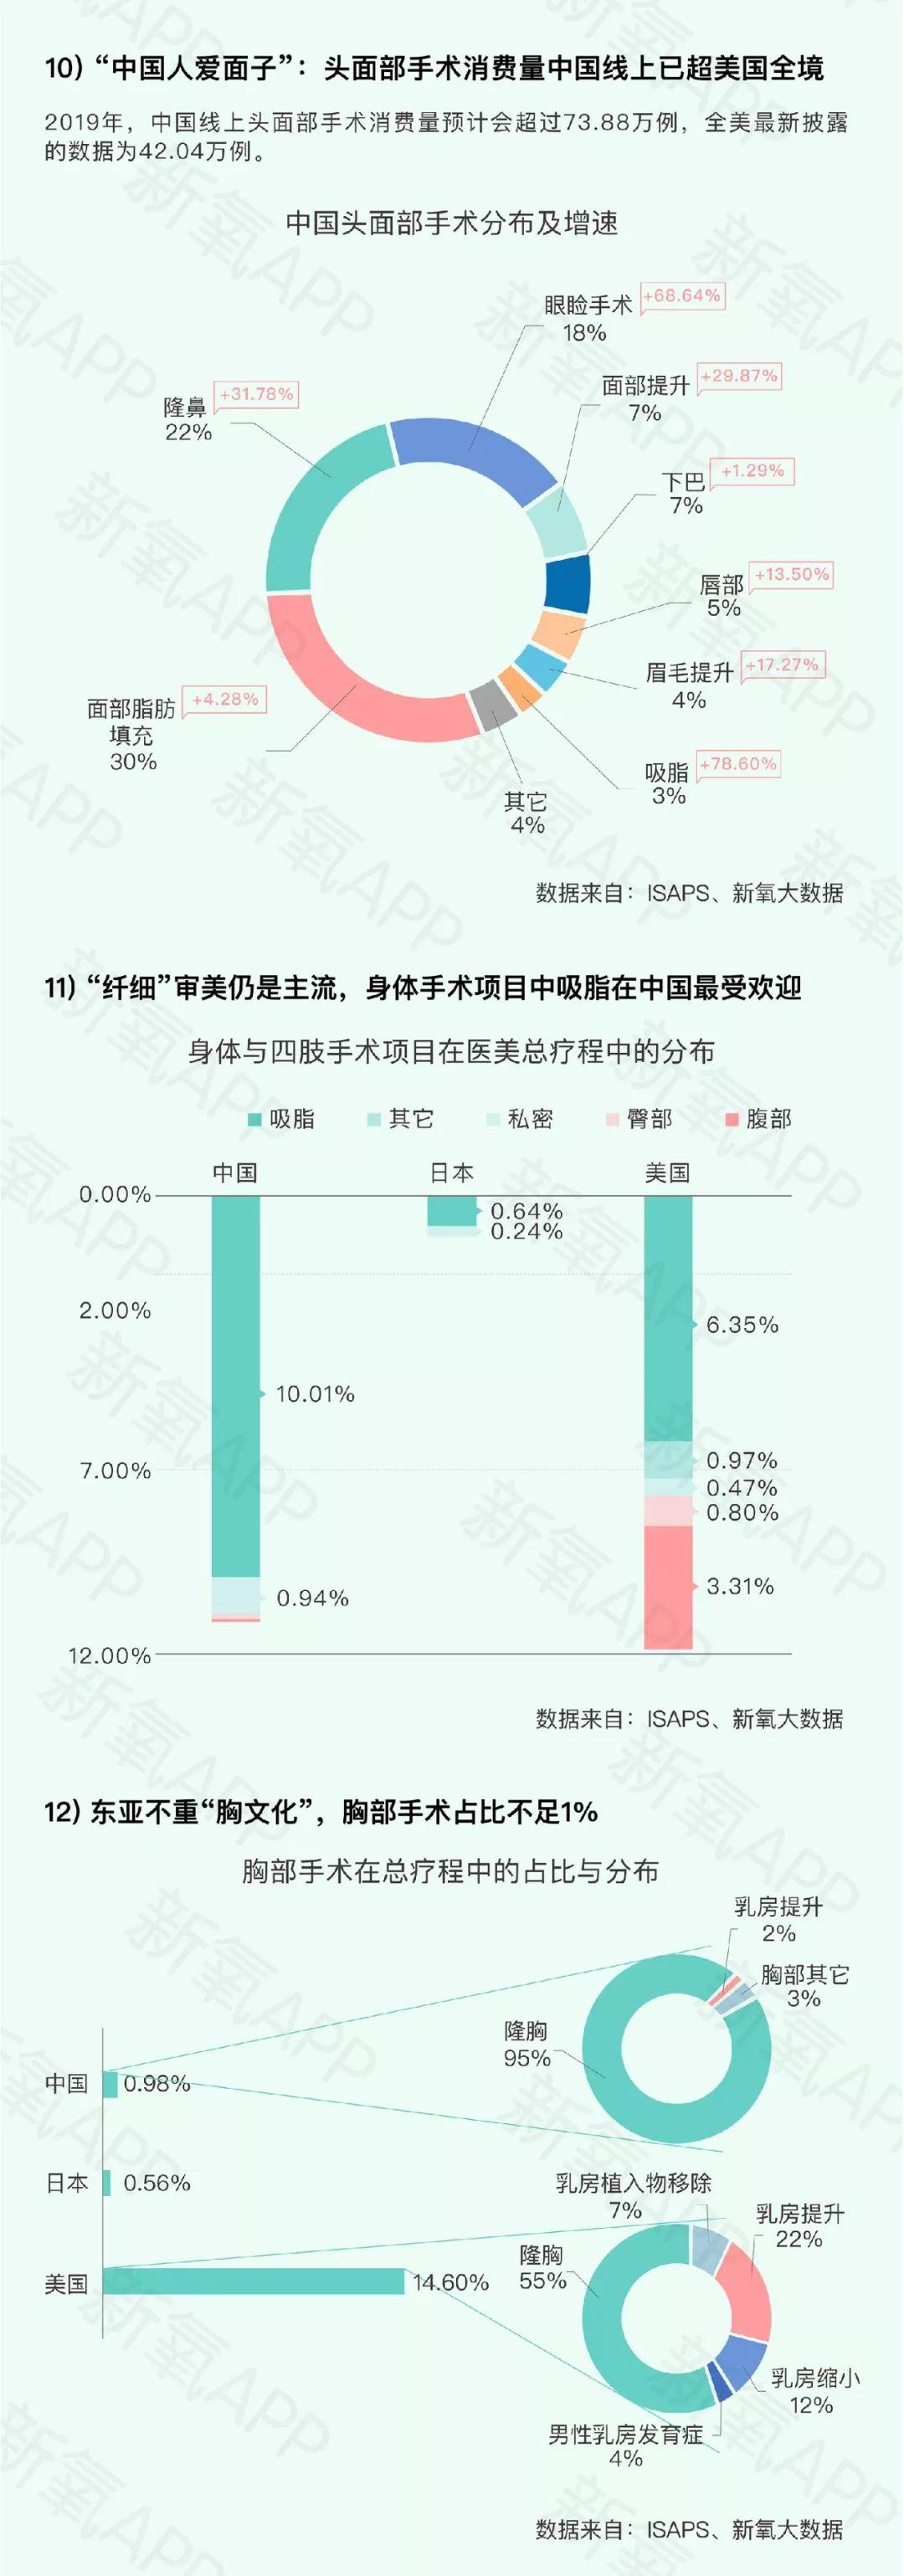
根据新氧大数据,中国头面部手术线上消费量中国已经远超美国全境。2019年中国线上市场头面部手术消费量预计会超过73.88万例,而美国最新披露的数据仅为42.04万例。在“面子”这件事情上,中国人做得最多的依次是面部脂肪填充、隆鼻、眼睑手术、面部提升和垫下巴等项目。
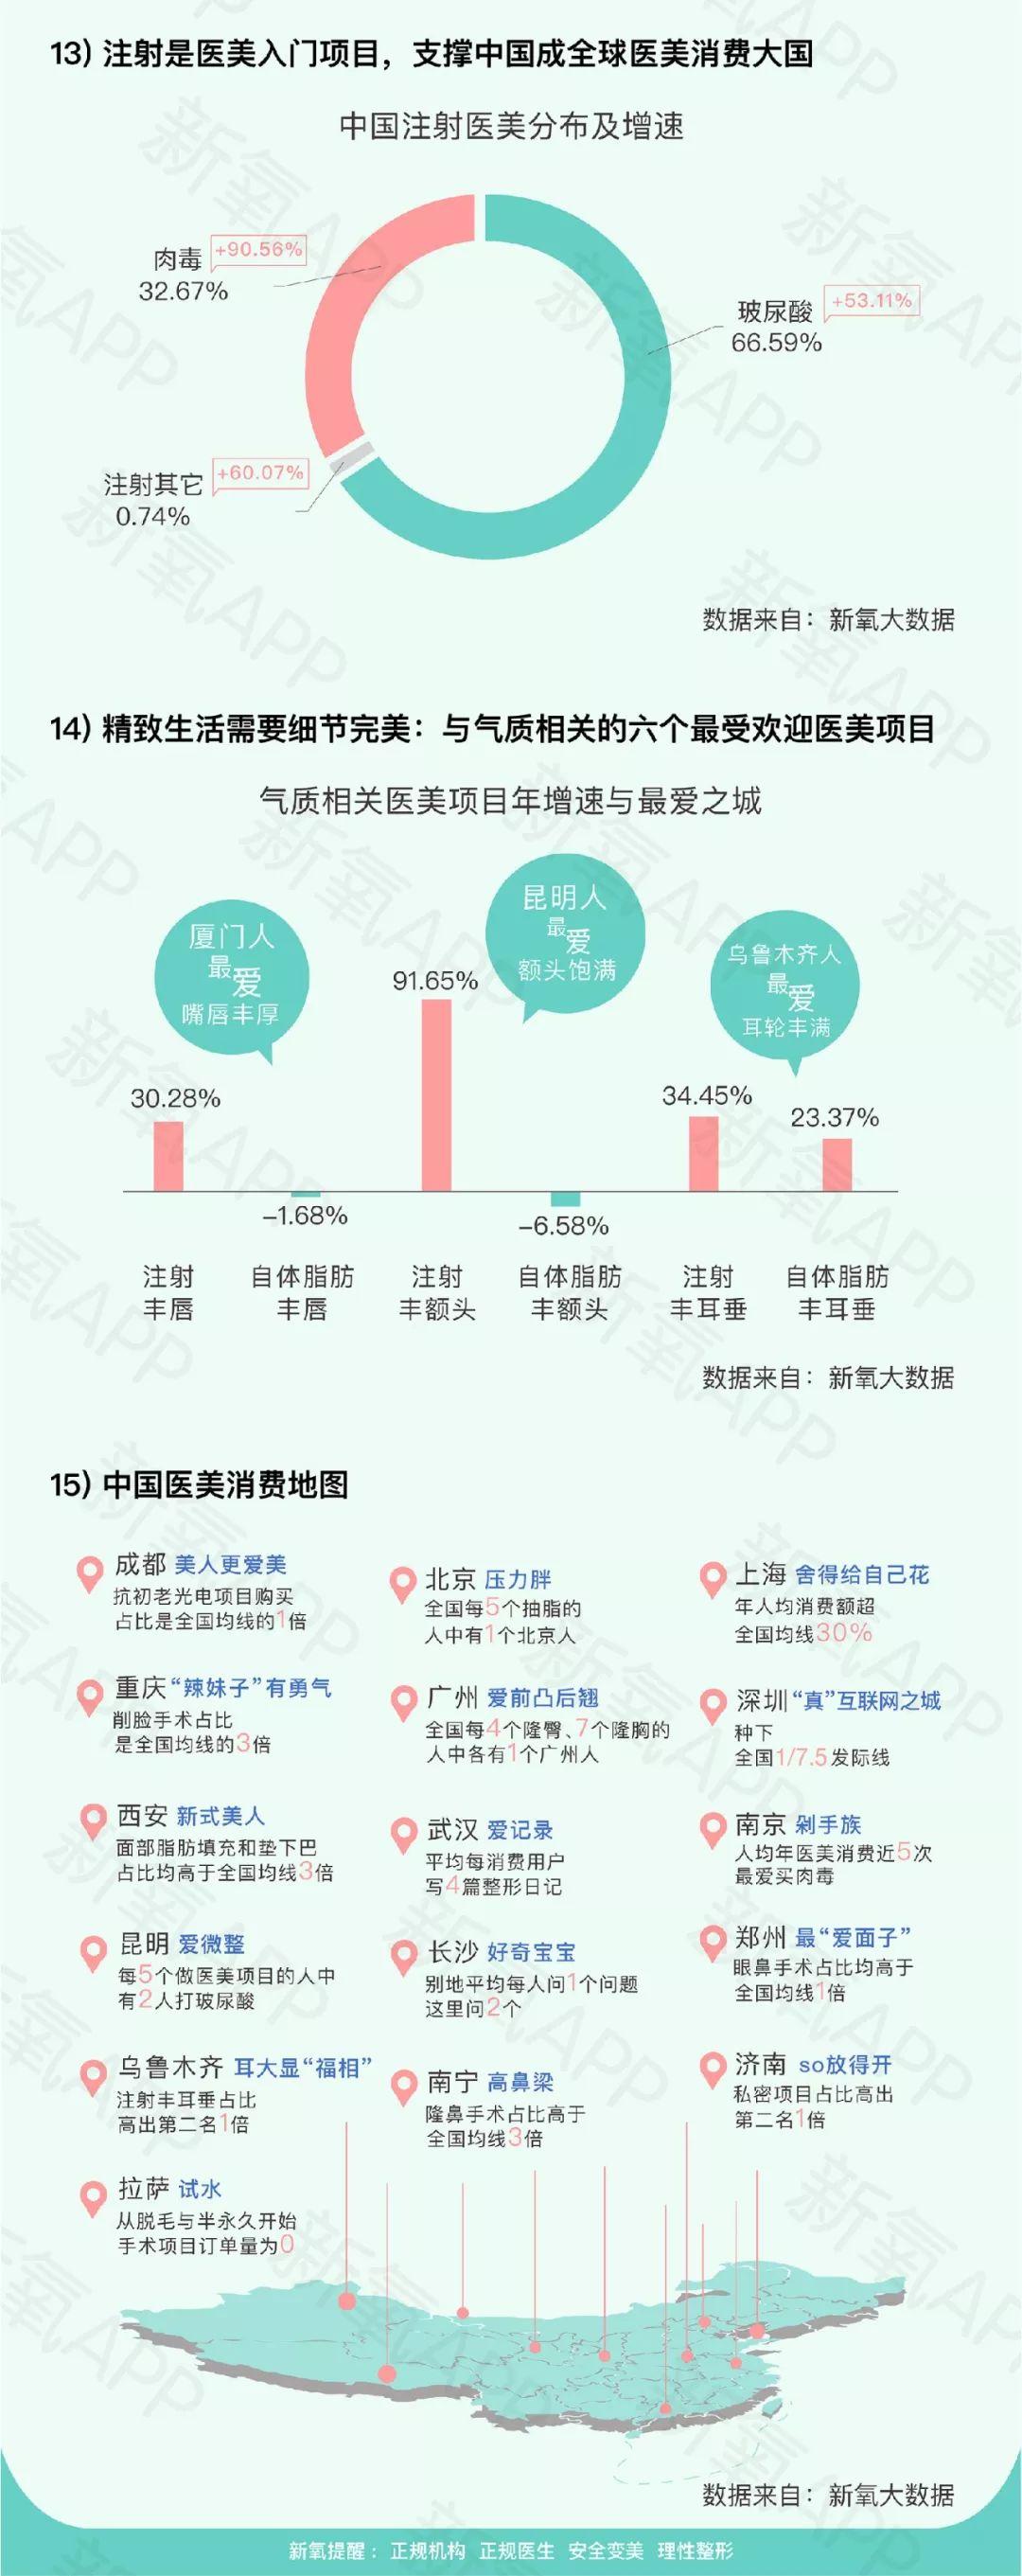
此外,纤细的审美依然在中国依然是主流。在身体手术项目中,吸脂在中国最受欢迎,中国吸脂手术在总医美消费中的占比已经高于美国。中国高线城市吸脂比率明显高于低线城市,其中北京是抽脂最大户,全国每5个抽脂的人中就有1个北京人。
不同地域也有着不同的喜好。通过“中国医美消费地图”,我们发现,一线城市的医美更多处理的是压力带来的影响,比如发胖、脱发、初老。比如北京的医美关键词主要是“压力胖”,抽脂颇受欢迎。又比如深圳,种下了全国1/7.5的发际线,可谓是“真”互联网之城。
而新一线和二线城市的医美喜好更多围绕变美。比如南京最多剁手族,人均医美消费近5次;重庆的削脸手术占比是全国均线的3倍,南宁的隆鼻手术占比高于全国均线3倍。
如果你对“中国人医美整形”背后的那些事儿,以及医美的发展趋势,抱有足够的好奇心,以下,Enjoy:
Follow us
Find us on
Facebook,
Twitter ,
Instagram, and
YouTube or frequent updates on all things investing.Have a financial topic you would like to discuss? Head over to the
uSMART Community to share your thoughts and insights about the market! Click the picture below to download and explore uSMART app!

Disclaimers
uSmart Securities Limited (“uSmart”) is based on its internal research and public third party information in preparation of this article. Although uSmart uses its best endeavours to ensure the content of this article is accurate, uSmart does not guarantee the accuracy, timeliness or completeness of the information of this article and is not responsible for any views/opinions/comments in this article. Opinions, forecasts and estimations reflect uSmart’s assessment as of the date of this article and are subject to change. uSmart has no obligation to notify you or anyone of any such changes. You must make independent analysis and judgment on any matters involved in this article. uSmart and any directors, officers, employees or agents of uSmart will not be liable for any loss or damage suffered by any person in reliance on any representation or omission in the content of this article. The content of the article is for reference only and does not constitute any offer, solicitation, recommendation, opinion or guarantee of any securities, virtual assets, financial products or instruments. Regulatory authorities may restrict the trading of virtual asset-related ETFs to only investors who meet specified requirements. Any calculations or images in the article are for illustrative purposes only.
Investment involves risks and the value and income from securities may rise or fall. Past performance is not indicative of future performance. Please carefully consider your personal risk tolerance, and consult independent professional advice if necessary.


