融信中国(03301.HK)核心业绩高增去杠杆卓有成效维持“增持”评级
机构:东吴证券
评级:增持
事件
融信中国公布2019年半年报:2019年上半年公司实现营业收入266.16亿元,同比增长86%;归母净利润19.79亿元,同比增长30%;核心归母净利润19.56亿元,同比增长26%,基本每股收益1.19元。
点评
核心归母净利润同比高增。2019年上半年公司实现营业收入266.16亿元,同比增长86%;归母净利润19.79亿元,同比增长30%;核心归母净利润19.56亿元,同比增长26%。归母净利润增长靓眼,主要源于公司结算规模提升明显,公司销售毛利率23.90%,较18年末提升0.43个百分点,销售净利率13.15%,盈利能力仍有较大提升空间。
销售增长稳健,土储聚焦高能级城市。2019年上半年公司销售金额达566.78亿元,同比增长4%;销售面积281.98万平米,同比增长11%;销售均价达20100元/平米。从区域布局看,杭州、福州、上海、南京、郑州分别贡献销售金额的35.8%、11.7%、11.0%、6.2%、4.0%。从土地储备看,截至2019年上半年,公司总土储建面达2654万平米,其中权益土储面积1414万平米,楼面均价6365元/平米,仅占同期销售均价的32%。从城市能级看,公司在一二线城市土储货值占比超80%;从区域布局看,公司布局九大城市群,深耕长三角、海西区域,覆盖43个城市;按土储权益面积划分,长三角、海西、中原、西北区域土储面积分别占比41.8%、25.3%、20.2%、5.2%。
投资力度回暖,加强合作严控拿地均价。2019年上半年公司新增23个土地项目,项目主要分布在苏州、杭州、温州、福州、重庆等核心城市,新增土地面积421万平米,同比增长69%;拿地总金额177亿元,同比增长65%,拿地金额权益比例为47%。公司投资力度有所提升,同时加大合作开发力度,严控拿地均价,2019年上半年公司新增项目楼面均价6451元/平米,占同期销售均价的32%。
降杠杆成效明显,融资成本持续改善。2019年上半年公司净负债率77%,较2018年末同比降低28个百分点。公司债务结构持续优化,短债占总债务比例降至31%,短期偿债压力较小。在杠杆水平有所回落背景下,上半年公司融资成本仅6.9%,较2018年继续降低0.2个百分点。
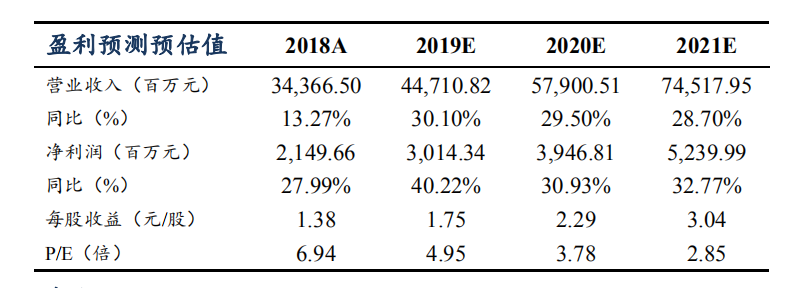
投资建议:融信中国坚持品质信仰,定位核心城市改善型需求。公司善于把握城市周期,践行城市深耕,销售规模持续高增,为公司未来业绩打下坚实基础。我们预计2019-2021年公司EPS分别1.75、2.29、3.04元人民币,对应PE分别为4.95、3.78、2.85倍。维持“增持”评级。
风险提示:行业销售波动;政策调整导致经营风险;融资环境变动;企业运营风险;汇率波动风险。
Follow us
Find us on
Facebook,
Twitter ,
Instagram, and
YouTube or frequent updates on all things investing.Have a financial topic you would like to discuss? Head over to the
uSMART Community to share your thoughts and insights about the market! Click the picture below to download and explore uSMART app!

Disclaimers
uSmart Securities Limited (“uSmart”) is based on its internal research and public third party information in preparation of this article. Although uSmart uses its best endeavours to ensure the content of this article is accurate, uSmart does not guarantee the accuracy, timeliness or completeness of the information of this article and is not responsible for any views/opinions/comments in this article. Opinions, forecasts and estimations reflect uSmart’s assessment as of the date of this article and are subject to change. uSmart has no obligation to notify you or anyone of any such changes. You must make independent analysis and judgment on any matters involved in this article. uSmart and any directors, officers, employees or agents of uSmart will not be liable for any loss or damage suffered by any person in reliance on any representation or omission in the content of this article. The content of the article is for reference only and does not constitute any offer, solicitation, recommendation, opinion or guarantee of any securities, virtual assets, financial products or instruments. Regulatory authorities may restrict the trading of virtual asset-related ETFs to only investors who meet specified requirements. Any calculations or images in the article are for illustrative purposes only.
Investment involves risks and the value and income from securities may rise or fall. Past performance is not indicative of future performance. Please carefully consider your personal risk tolerance, and consult independent professional advice if necessary.


