海底捞(06862.HK)自下而上裂变增长给予“增持”评级目标价32.9港币
机构:申万宏源
评级:增持
目标价:32.9港币
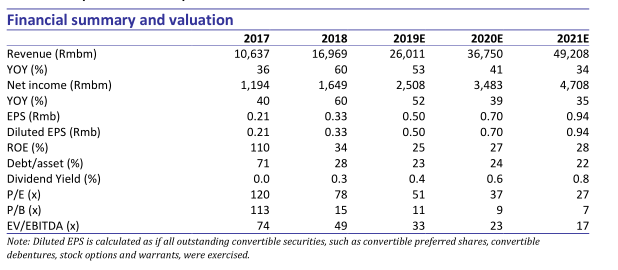
按照2017年的收入计算,海底捞在中国和全球的中式餐饮市场中均排名第一。截至2018年底,公司已开设466家餐厅,全部为自营,客单价人民币100元左右,定位中高端市场。海底捞每年服务超过1亿人次的顾客,品牌的受欢迎程度体现在高翻台率(18年为5.0)和快于行业的盈亏平衡和现金回报时间。2015-18年,公司的收入复合增长43%,净利润复合增长59%。我们认为公司将凭借良好的激励制度,全火锅产业链布局,和持续渗透的潜力,继续取得强劲的增长。我们预测19年每股收益人民币0.50元(同比增长51.5%),20年0.70元(同比增长40.0%),21年0.94元(同比增长34.3%)。我们给予公司目标价32.9港币(1.6倍19年PEG),对应10.2%的上涨空间,首次覆盖给予增持评级。
竞争优势。海底捞的“连住利益,锁住管理”的管理理念促使员工的利益与公司保持一致,推动自下而上的增长,并通过控制系统性风险,确保一致的战略方向和食品质量。2016年中的内部管理体系重组使得公司的管理结构更加扁平,并激励店长带更多的徒弟,加快了新店的开店速度。客户满意度是公司的主要考核指标,确保了高水平的服务,也使服务得以成功复制。涉足整个火锅产业链的垂直生态系统帮助海底捞专注于餐厅运营,实现高效的扩张。先进技术的应用有助于改善客户用餐体验,规范运营并确保食品安全。
盈利预测。我们估计海底捞在中国大陆可以开2,558家门店,其中一线城市321家,二线城市675家,低线城市1,562家。我们预测18至21年公司的收入复合增长率为43%,主要受新开店的驱动(预计19至21年每年新开250家),同店销售维持中单位数的增长。我们预测净利润复合增长率为42%,略低于收入增速,主要由于快速开店和原材料成本的上涨。我们预计公司的自由现金流将在19年转正,得益于强劲的经营净现金流,抵消了资本支出的上升。我们认为公司的资产负债表将保持稳健,18年已实现净现金。
首次覆盖给予增持评级。我们给予公司目标价32.90港币,意味着66倍19年PE,根据我们2018-21年净利润复合增长42%的预测,意味着1.6倍PEG,我们认为较为合理,因为与港股可比公司1.6倍PEG一致,低于美股可比公司2.4倍PEG。我们认为海底捞可以类比美股公司墨式烧烤(CMG:US)在美股餐饮行业享受溢价,而在港股市场享有溢价,因为海底捞盈利增长更高,品牌知名度更高,以及公司涉足全火锅产业链而不仅仅是餐厅业务。我们的目标价对应10.2%的上涨空间,首次覆盖给予增持评级。
Follow us
Find us on
Facebook,
Twitter ,
Instagram, and
YouTube or frequent updates on all things investing.Have a financial topic you would like to discuss? Head over to the
uSMART Community to share your thoughts and insights about the market! Click the picture below to download and explore uSMART app!

Disclaimers
uSmart Securities Limited (“uSmart”) is based on its internal research and public third party information in preparation of this article. Although uSmart uses its best endeavours to ensure the content of this article is accurate, uSmart does not guarantee the accuracy, timeliness or completeness of the information of this article and is not responsible for any views/opinions/comments in this article. Opinions, forecasts and estimations reflect uSmart’s assessment as of the date of this article and are subject to change. uSmart has no obligation to notify you or anyone of any such changes. You must make independent analysis and judgment on any matters involved in this article. uSmart and any directors, officers, employees or agents of uSmart will not be liable for any loss or damage suffered by any person in reliance on any representation or omission in the content of this article. The content of the article is for reference only and does not constitute any offer, solicitation, recommendation, opinion or guarantee of any securities, virtual assets, financial products or instruments. Regulatory authorities may restrict the trading of virtual asset-related ETFs to only investors who meet specified requirements. Any calculations or images in the article are for illustrative purposes only.
Investment involves risks and the value and income from securities may rise or fall. Past performance is not indicative of future performance. Please carefully consider your personal risk tolerance, and consult independent professional advice if necessary.


