


作者:国海研究*靳毅团队
来源:靳论固收”
投资要点
权益市场
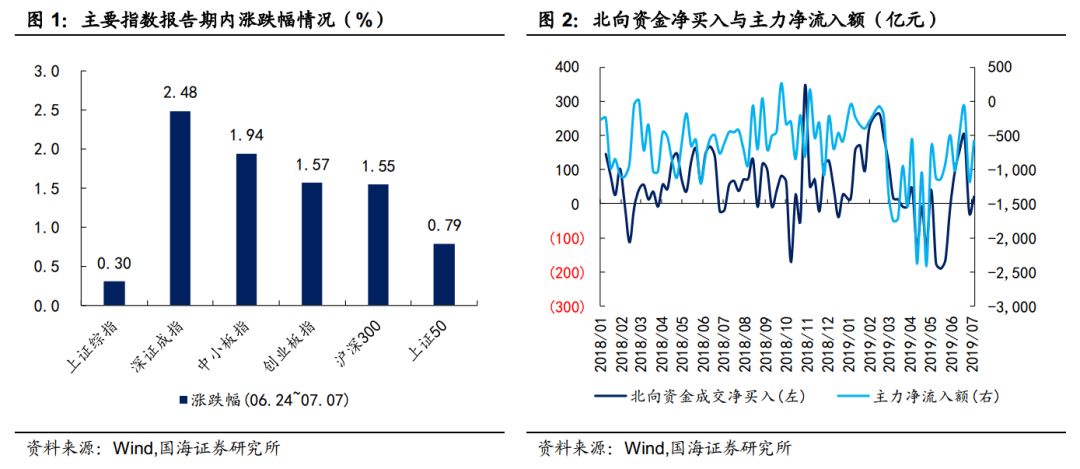
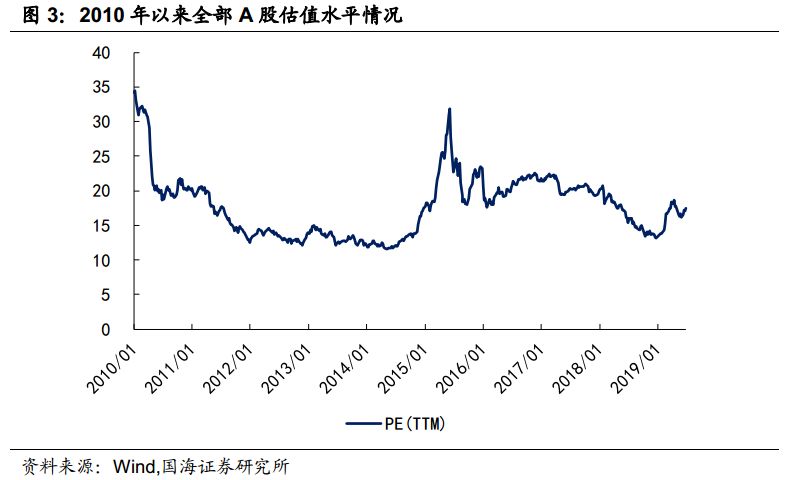
报告期内(2019.06.24-2019.07.07),权益市场震荡上行,上证综指上涨0.30%,深圳成指上涨2.48%,创业板指上涨1.57%。沪深两市主力资金累计净流出1750.04亿元,较上期有所增加;北向资金成交净买入额为-5.48亿元,较前期也有所降低。细分来看,按照行业分类,报告期内家用电器、食品饮料、国防军工涨幅最大,分别为5.82%、5.70%、5.65%;而传媒和有色金属涨幅最小,分别为-3.17%、-1.84%。市场整体估值稍微抬升,行业估值较上期未发生明显变化,仍然是计算机、通信、农林牧渔和食品饮料行业较其他行业估值稍高,但也基本上保持在中位数水平附近。
转债二级市场
报告期内,转债市场表现弱于权益市场,其中中证转债上涨0.55%,上证转债上涨0.33%,深证转债上涨0.93%。转债累计成交额644亿元,日均成交额64亿元,较上期进一步上升。个券表现以上涨为主,有125只转债价格上涨,40只转债价格下跌。转股溢价率方面,地产和建筑装饰平均转股溢价率仍然最高,中盘券转股溢价率仍然最高,2018年以来上市的新券转股溢价率仍然显著低于老券。
转债一级市场
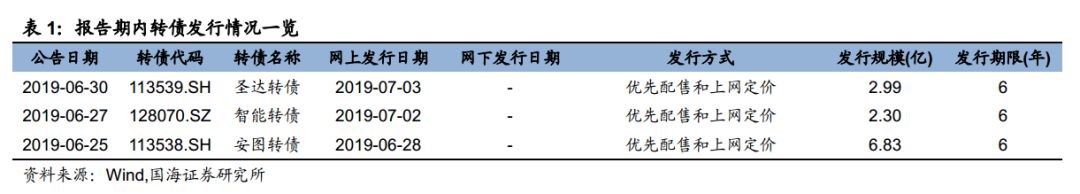
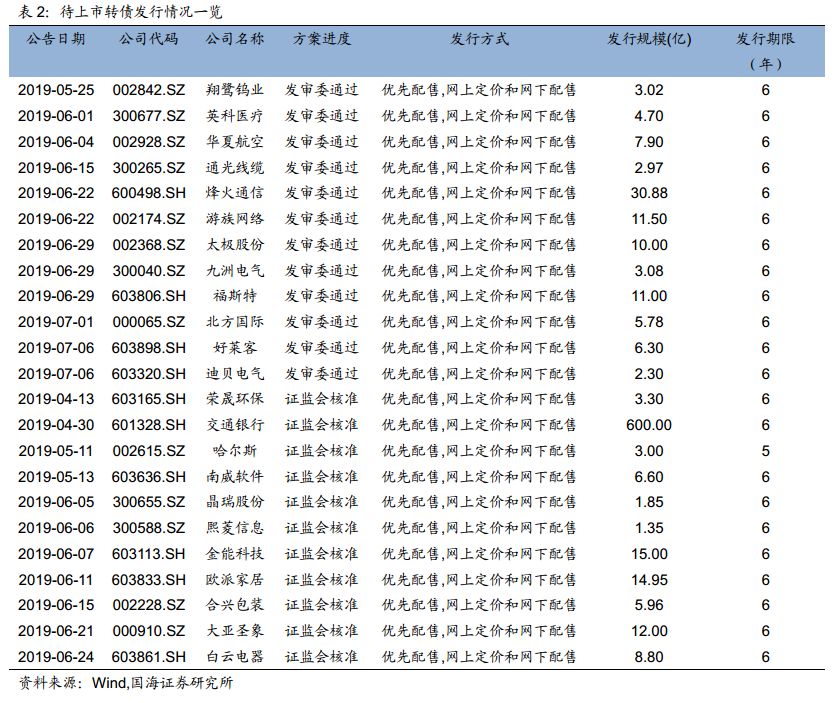
报告期内,共有3只新券发行,为圣达转债、智能转债和安图转债。共有5只新券上市,为文灿转债、蓝晓转债、和而转债、中环转债和三星转债。统计转债发行预案,目前有11家转债已通过证监会核准但尚未发行,有13家已通过发审委审核,合计24家,总规模达774.38亿元。
基金持仓跟踪
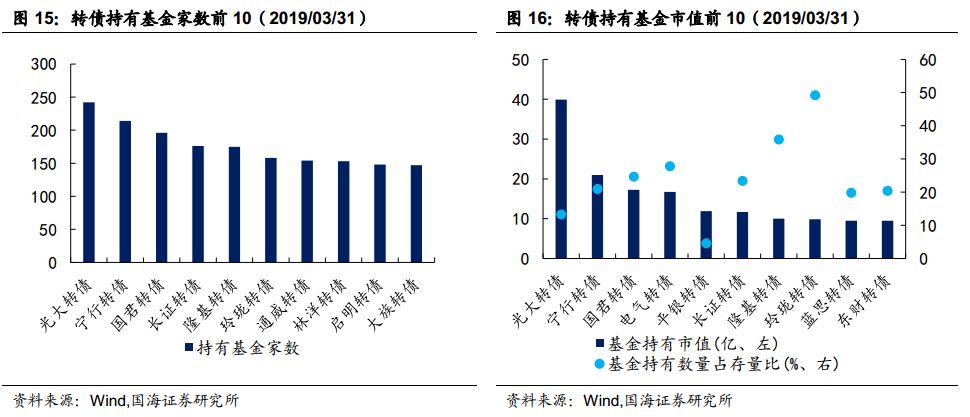
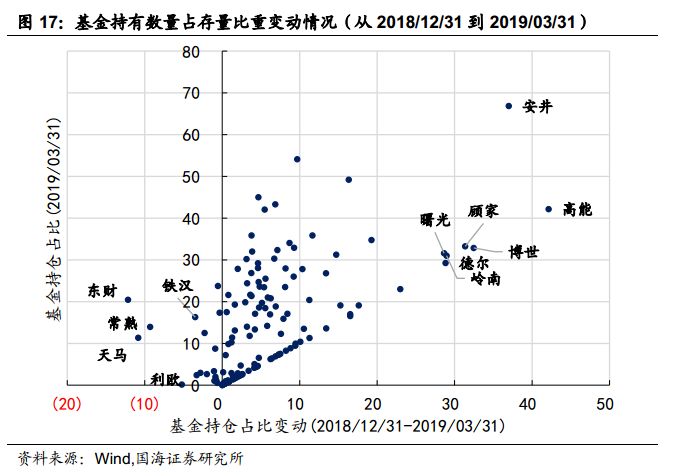
截至2019年一季度末,存量转债中基金持有家数前三分别是光大转债、宁行转债和国君转债,同样也是基金持有市值前三转债。从2018/12/31到2019/03/31,基金持仓占比提升最多的是高能转债(+42.13%)、安井转债(+37.00%)、博世转债(+32.47%);下降最多的是东财转债(-12.16%)、天马转债(-10.83%)、常熟转债(-9.31%)。
风险提示
权益市场向下调整幅度超预期、市场资金面趋紧
一、二级市场概况
1.1、权益市场
报告期内(2019.06.24-2019.07.07),权益市场震荡上行。截至7月5日收盘,上证综指上涨0.30%,报收3,011点;深圳成指上涨2.48%,报收9,443点;创业板指上涨1.57%,报收1,548点。报告期内,沪深两市主力资金累计净流出1750.04亿元,较上期有所增加;北向资金成交净买入额为-5.48亿元,较前期也有所降低。
细分来看,按照行业分类,报告期内家用电器、食品饮料、国防军工涨幅最大,分别为5.82%、5.70%、5.65%;而传媒和有色金属涨幅最小,分别为-3.17%、-1.84%。对应地,报告期内主力净流入额靠前的行业也是家用电器、纺织服装等消费类板块。


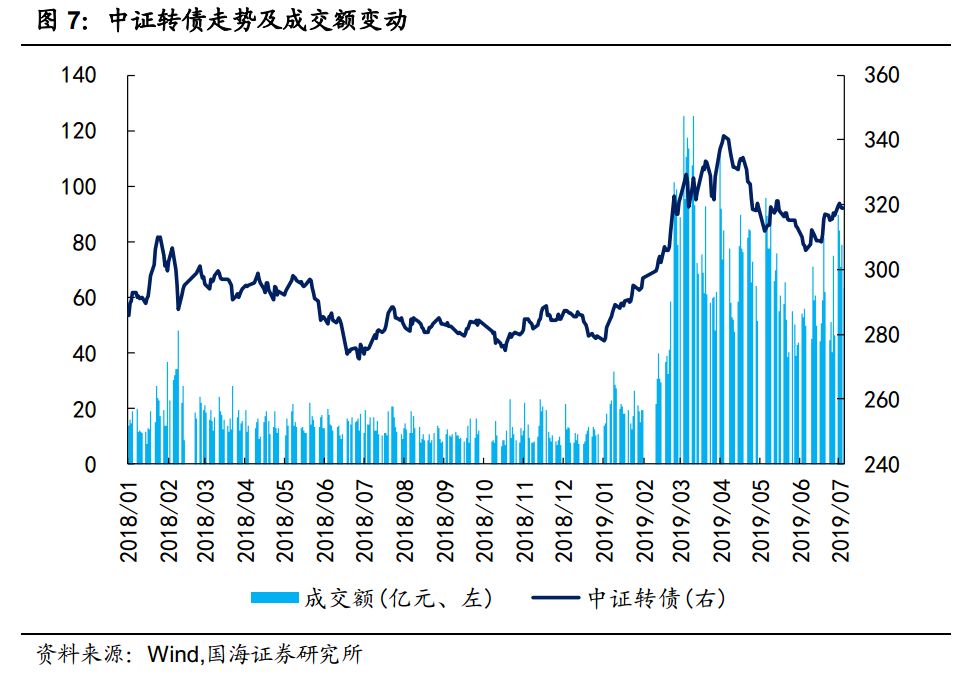
市场整体估值稍微抬升,截至7月5日,全市场PE(TTM)为17.40倍。行业估值较上期未发生明显变化,仍然是计算机、通信、农林牧渔和食品饮料行业较其他行业估值稍高,但也基本上保持在中位数水平附近。
1.2、转债市场
报告期内,转债市场表现弱于权益市场,其中中证转债上涨0.55%,报收319点;上证转债上涨0.33%,报收296点;深证转债上涨0.93%,报收205点。报告期内,转债累计成交额644亿元,日均成交额64亿元,较上期进一步上升。
存量转债方面,截至7月5日,存量公募可转债共计165只,转债总余额约为人民币3,086.85亿元。其中有139只债券收盘价格大于等于100元的发行面值。票面价格最高的为特发转债,收于218.18元;票面价格最低为模塑转债,收于92.62元。
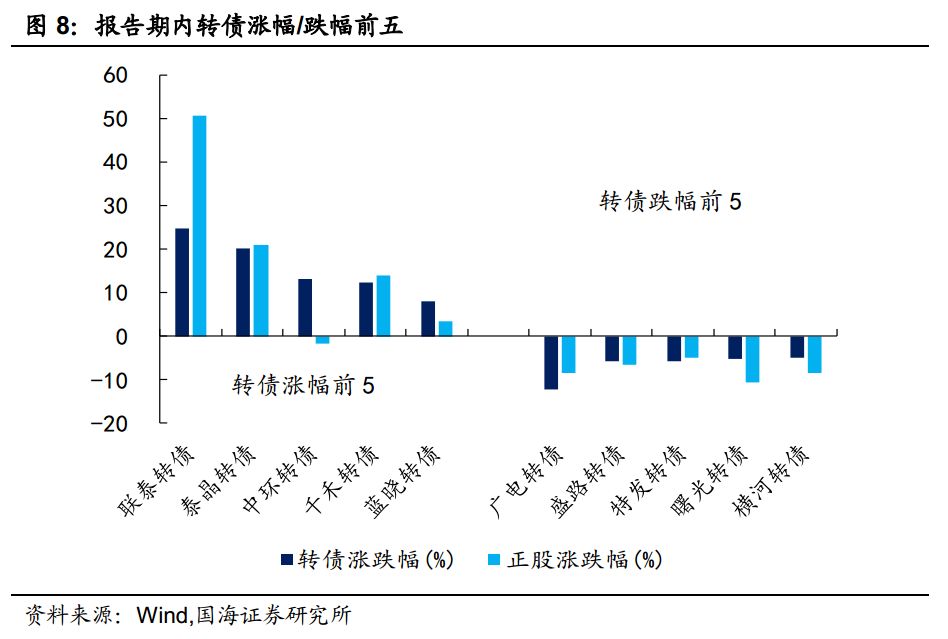
报告期内,个券表现以上涨为主。有125只转债价格上涨,其中涨幅前五分别是联泰转债(24.59%)、泰晶转债(20.15%)、中环转债(13.11%)、千禾转债(12.16%)、蓝晓转债(7.88%);有40只转债价格下跌,其中跌幅前五分别是广电转债(-12.11%)、盛路转债(-5.88%)、特发转债(-5.73%)、曙光转债(-5.29%)、横河转债(-4.93%)。
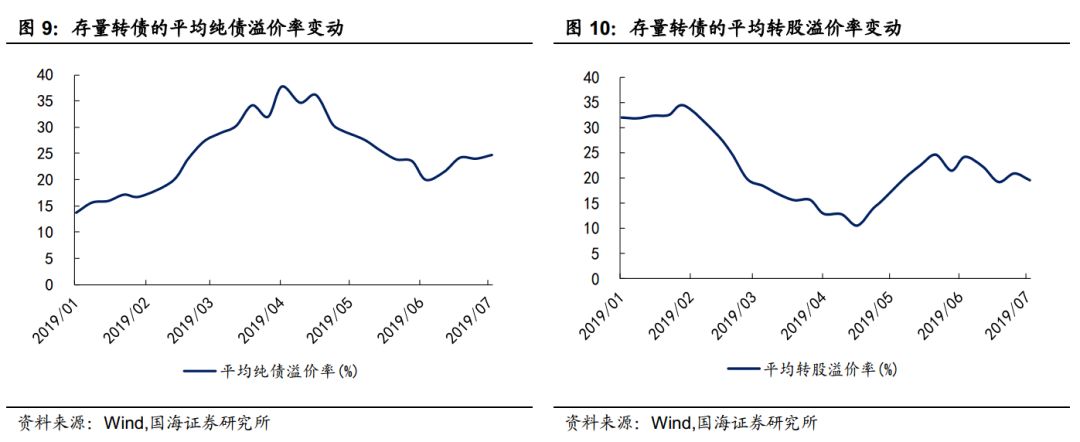
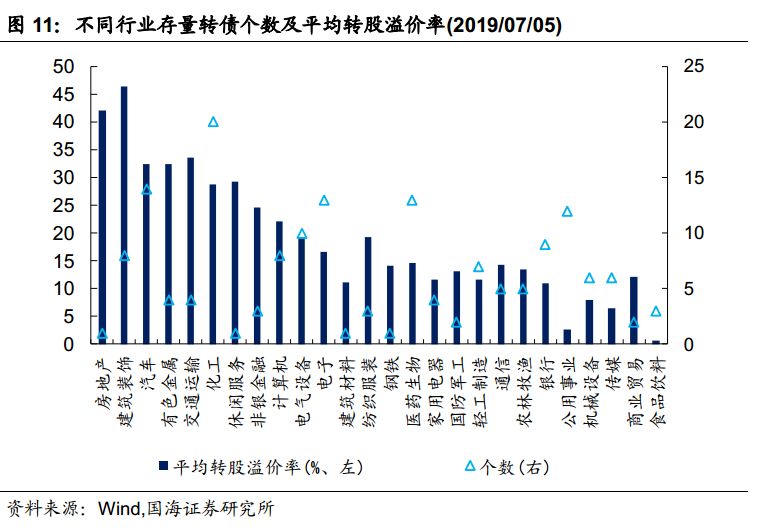
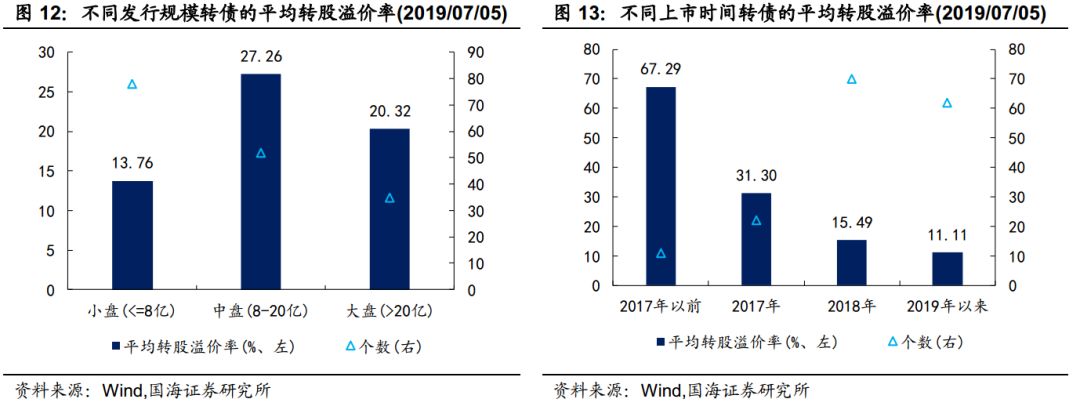
伴随股票市场震荡上行,存量转债的平均纯债溢价率进一步抬升,相反地平均转股溢价率进一步回落,股性进一步增强,债性进一步变弱。截至2019年7月5日,平均纯债溢价率为24.70%,平均转股溢价率为19.40%。其中地产和建筑装饰平均转股溢价率仍然最高,食品饮料、商业贸易和传媒平均转股溢价率较低。相对而言,中盘券转股溢价率仍然最高。2018年以来上市的新券转股溢价率仍然显著低于老券。
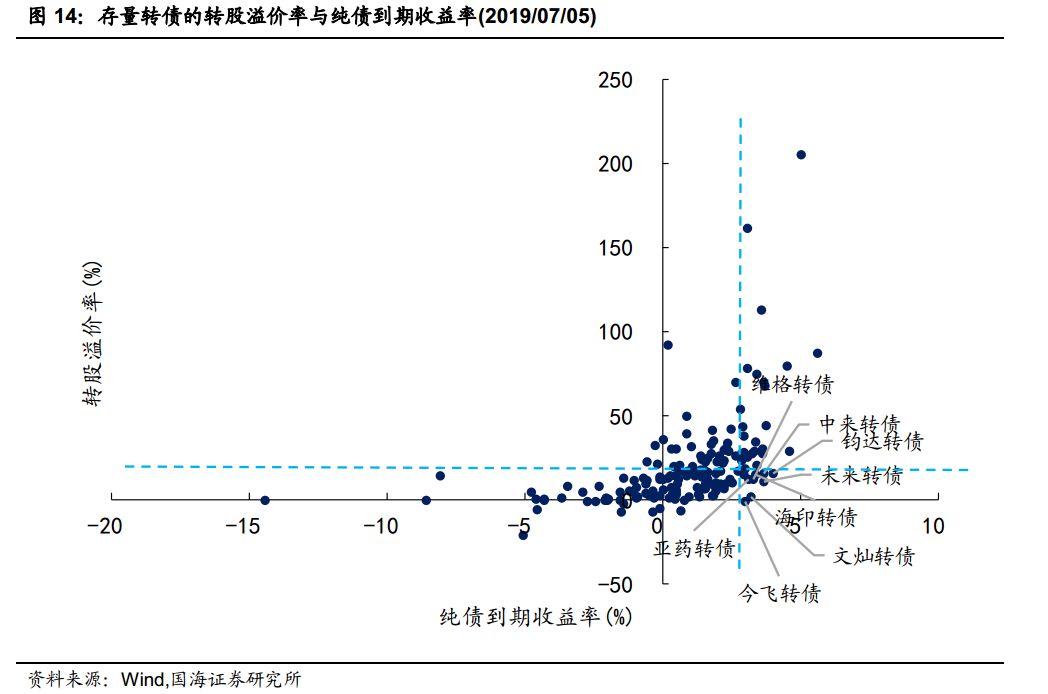
目前,大部分存量转债的转股溢价率水平分布在0%-40%,纯债到期收益率分布在0%-4%。不考虑正股基本面,单纯考虑转债性价比(转股溢价率低于20%,纯债到期收益率高于3%),截至7月5日,中来转债(15.67%/3.67%)、钧达转债(15.53%/4.01%)、海印转债(14.64%/3.39%)、维格转债(11.76%/3.30%)、亚药转债(11.88%/3.11%)、未来转债(10.33%/3.68%)、文灿转债(1.46%/3.19%)、今飞转债(-1.40%/3.01%)满足要求。
二、一级市场概况
2.1、发行与上市
报告期内,共有3只新券发行,为圣达转债(7月3日网上发行,募集资金2.99亿元)、智能转债(7月2日网上发行,募集资金2.30亿元)、安图转债(6月28日网上发行,募集资金6.83亿元)。共有5只新券上市,为文灿转债(7月5日上市,募集资金8.00亿元),上市首日上涨1.66%;蓝晓转债(7月4日上市,募集资金3.40亿元),上市首日上涨7.80%;和而转债(7月1日上市,募集资金5.47亿元),上市首日上涨11.00%;中环转债(7月1日上市,募集资金2.90亿元),上市首日上涨10.65%;三星转债(6月24日上市,募集资金1.92亿元),上市首日上涨2.08%。
2.2、待上市情况
统计转债发行预案,目前有11家转债已通过证监会核准但尚未发行,有13家已通过发审委审核,合计24家,总规模达774.38亿元。
三、基金持仓跟踪
截至2019年一季度末,存量转债中基金持有家数前三分别是光大转债、宁行转债和国君转债,同样也是基金持有市值前三转债。从2018/12/31到2019/03/31,基金持仓占比提升最多的是高能转债(+42.13%)、安井转债(+37.00%)、博世转债(+32.47%);下降最多的是东财转债(-12.16%)、天马转债(-10.83%)、常熟转债(-9.31%)。
四、风险提示
第一,权益市场走低、存在跌幅超预期的潜在可能性。
第二,市场整体资金面趋紧程度超预期。


More Content


