光伏概念股走強,光伏ETF升超3%
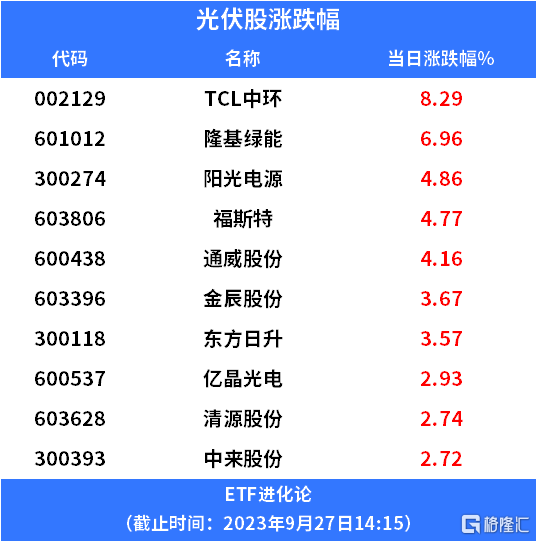
格隆匯9月27日丨光伏股集體走強,愛旭股份逼近升停,晶澳科技升超5%,TCL中環、隆基綠能、陽光電源、福斯特、通威股份、金辰股份、東方日升升超3%。
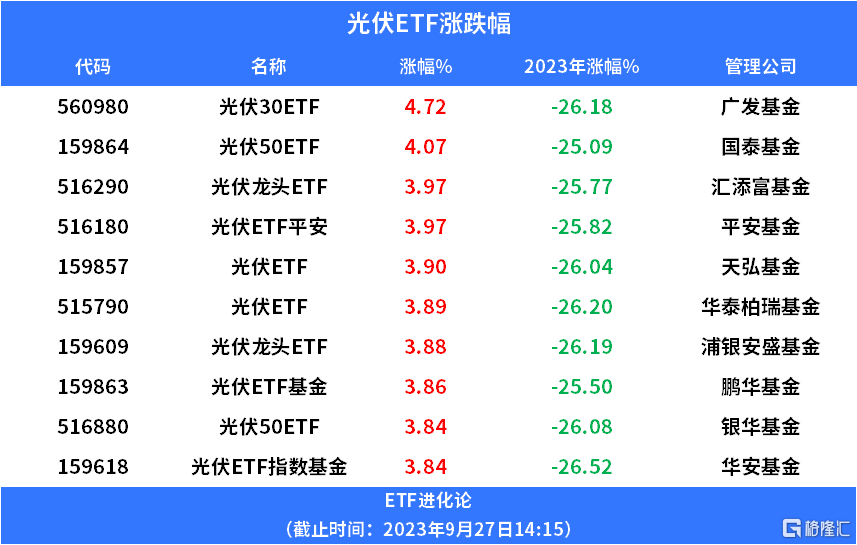
ETF方面,廣發基金光伏30ETF、國泰基金光伏50ETF、匯添富基金光伏龍頭ETF、光伏ETF平安、天弘基金光伏ETF、華泰柏瑞基金光伏ETF、浦銀安盛基金光伏龍頭ETF、鵬華基金光伏ETF基金、銀華基金光伏50ETF、華安基金光伏ETF指數基金升超3%。
消息面上,國家統計局今早公佈數據顯示,8月規模以上工業企業利潤由降轉增,同比增長17.2%。裝備製造業利潤增長加快。工業新動能持續壯大,1—8月份,裝備製造業利潤同比增長3.6%,增速較1—7月份加快1.9個百分點。裝備製造業利潤增速高於規上工業平均水平15.3個百分點,持續引領工業企業利潤穩步恢復。分行業看,電氣機械、鐵路船舶航空航天運輸設備行業利潤分別增長33.0%、32.5%,保持較高增速;汽車行業利潤增長2.4%,增速加快1.4個百分點;電子行業受產銷回升等因素帶動,利潤降幅收窄5.8個百分點。
另外,歐盟更新後的可再生能源指令(RED)設定了歐盟清潔能源使用的目標,推動該地區在2030年底前將風電和光伏裝機容量提高兩倍。此前9月12日,歐洲議會正式通過決議,將2030年歐盟國家的可再生能源目標從32%提升為42.5%。據瞭解,歐盟此次官宣新的能源效率指令,旨在進一步減少對化石燃料的依賴。因歐洲對外能源依存度較高以及可再生能源不足等問題,歐洲在2022年俄烏衝突爆發以來經歷了前所未有的能源危機,據歷史數據顯示,歐洲天然氣價格最高達到疫情前水平的10倍,歐洲主要市場明年交割的電力期貨交易價曾升至去年同期的8倍。在此背景下,歐盟勢必減少石化能源的消耗量和依賴度,而這無疑要加大對新能源的使用量。
從光伏行業基本面看,國家能源局公佈1-8月國內新增光伏裝機113.2吉瓦,同比大增154.5%,其中8月16.0吉瓦,同比增長137.4%,但環比下降14.6%。在6-7月環比持續快速增長至高基數後,交銀國際認為8月環比有所下降仍屬正常。根據歷史經驗,預計9-11月環比將波動較小,12月搶裝下單月則有望達到30吉瓦,全年新增裝機將同比大增155%至約190吉瓦。
對於光伏行業,中誠信國際表示:2023年上半年,硅料產能的集中釋放令硅料價格延續跌勢,產業鏈價格處於下行通道,成本的降低進一步刺激了光伏裝機需求的增長,各環節出貨量增高,利潤水平有所分化,主產業鏈利潤從上游環節部分轉移至中下游,電池片、組件企業盈利水平邊際修復;三季度以來,硅料、硅片及電池片價格築底企穩,但升幅有限,組件價格調整相對滯後,若各環節規劃項目如期推進,產業鏈價格預計將低位震盪。光伏行業馬太效應仍較為明顯,頭部企業憑藉較強的成本控制能力、規模優勢及技術優勢,佔據較大比重的市場份額與利潤空間。
在“碳中和”的大背景下,考慮到產業鏈成本的降低以及國家相關政策的大力推動,加之海外各國持續推進能源結構轉型,未來全球光伏裝機的高增長預期不變。考慮到下游需求的穩定性、技術迭代及鞏固行業地位,光伏產業鏈延續擴產週期,龍頭企業向上下游延伸,佈局一體化項目以及新型電池技術,投融資規模較大,不同環節的供需錯配逐步顯現,行業或將出現階段性產能過剩,需關注未來產能消納、資金平衡情況以及融資政策變動等因素所帶來的影響。
山西證券則認為,市場上存在對光伏行業產能過剩的擔憂,認為會影響未來企業盈利能力。該擔憂已經在估值上有所體現,光伏指數PE-TTM降至5年以來最低位,且在所有基金持倉中,SW光伏設備的佔比降至3.2%。但高質量、優質產能依舊相對緊缺。“降本增效”推進光伏行業不斷進行技術迭代,當前PERC電池已經迫近理論效率極限,N型替代大勢所趨,BC電池技術有望成為未來主流,存在結構性機會。
Follow us
Find us on
Facebook,
Twitter ,
Instagram, and
YouTube or frequent updates on all things investing.Have a financial topic you would like to discuss? Head over to the
uSMART Community to share your thoughts and insights about the market! Click the picture below to download and explore uSMART app!

Disclaimers
uSmart Securities Limited (“uSmart”) is based on its internal research and public third party information in preparation of this article. Although uSmart uses its best endeavours to ensure the content of this article is accurate, uSmart does not guarantee the accuracy, timeliness or completeness of the information of this article and is not responsible for any views/opinions/comments in this article. Opinions, forecasts and estimations reflect uSmart’s assessment as of the date of this article and are subject to change. uSmart has no obligation to notify you or anyone of any such changes. You must make independent analysis and judgment on any matters involved in this article. uSmart and any directors, officers, employees or agents of uSmart will not be liable for any loss or damage suffered by any person in reliance on any representation or omission in the content of this article. The content of the article is for reference only and does not constitute any offer, solicitation, recommendation, opinion or guarantee of any securities, virtual assets, financial products or instruments. Regulatory authorities may restrict the trading of virtual asset-related ETFs to only investors who meet specified requirements. Any calculations or images in the article are for illustrative purposes only.
Investment involves risks and the value and income from securities may rise or fall. Past performance is not indicative of future performance. Please carefully consider your personal risk tolerance, and consult independent professional advice if necessary.


