


如何預測2023年?
uSMART盈立智投 01-06 14:42
展望2023年:兔躍新程
- 鑑於2022年流動性和基本面雙觸底,在防疫政策持續優化、地產政策開始回暖、美聯儲加息週期進入尾聲等因素刺激下,看多2023年港股。
- 防疫政策的持續優化令“中國開關”成爲全球投資者重要的投資主題,地產政策的持續回暖一方面令地產板塊反彈明顯,另一方面也令權重的大金融板塊,特別是銀行保險等資產端與地產關聯度較高的行業估值有所修復。
- 2023年初可能是市場反彈的重要窗口,而年中前後市場可能迎來向上向下因素的拉鋸戰。科網板塊仍然是平衡了彈性和可持續性後的首選,醫藥和大金融等板塊亦有可能迎來估值修復的行情。
美元指數下行+中國PMI上行,港股收益明顯
- 港股市場目前整體的投資者結構仍呈現大致4:3:3的格局,即海外投資者佔比約40%,本地投資者佔比約30%,內地投資者佔比約30%,海外投資者仍處於佔比較高的水平。
- 在美元指數下行+中國PMI上行的宏觀組合時期,港股均錄得不俗的絕對收益。展望2023年,美元指數趨勢下行,中國經濟復甦PMI回暖的背景下,港股有望錄得正收益。
歷史上出現趨勢性的美元指數下行+中國PMI上行的時期,港股均錄得不俗的正收益表現
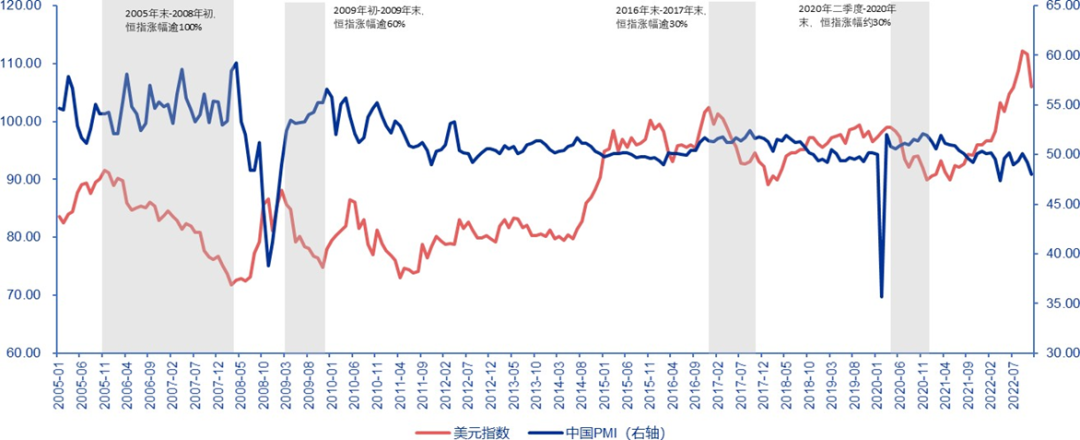
資料來源:Wind,申萬宏源研究
反彈主要由空頭回補和被動基金流入所推動
- “做空比例大幅擡升+市場現貨成交逐漸回落”這一組合主導了2022年三季度以來的市場表現, 但在防疫政策優化、地產政策回暖、美國通脹數據不及預期等利好消息的刺激下,空頭回補成爲了短期市場快速反彈的重要驅動力之一。
做空比例大幅回落,現貨成交快速回暖,市場已經從此前的脆弱結構中走出
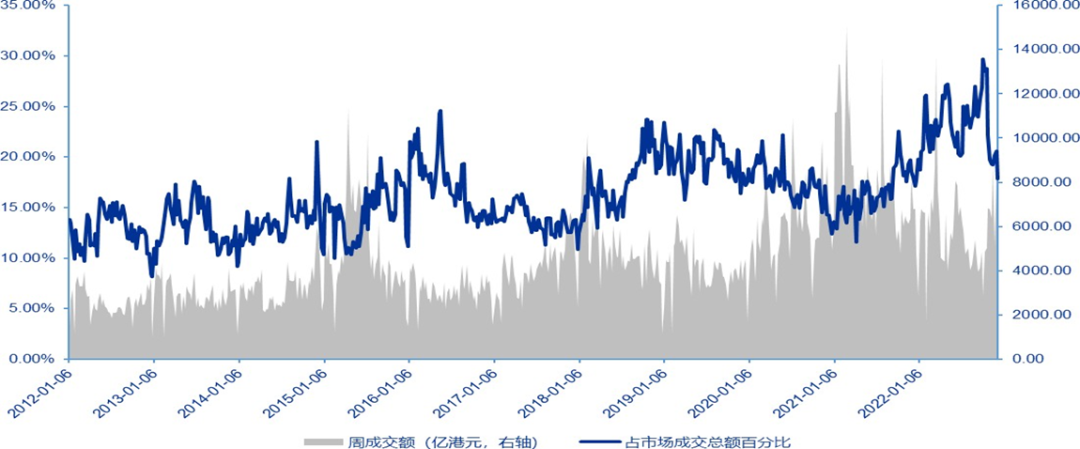
資料來源:Wind,申萬宏源研究外資迴流值得期待
- 根據EPFR的數據顯示,被動基金的淨流入爲2022年年底以來市場反彈的主要推動力。
- 雖然表現爲流出規模的持續縮小。我們認爲這和外資機構的交易習慣有關,在歲末時間少見系統性地改變當年的投資大方向。換言之,2023年年初潛在的外資迴流值得期待。
海外註冊的被動管理型基金是近期流入的主要資金,同時伴隨着人民幣匯率的強勢反彈
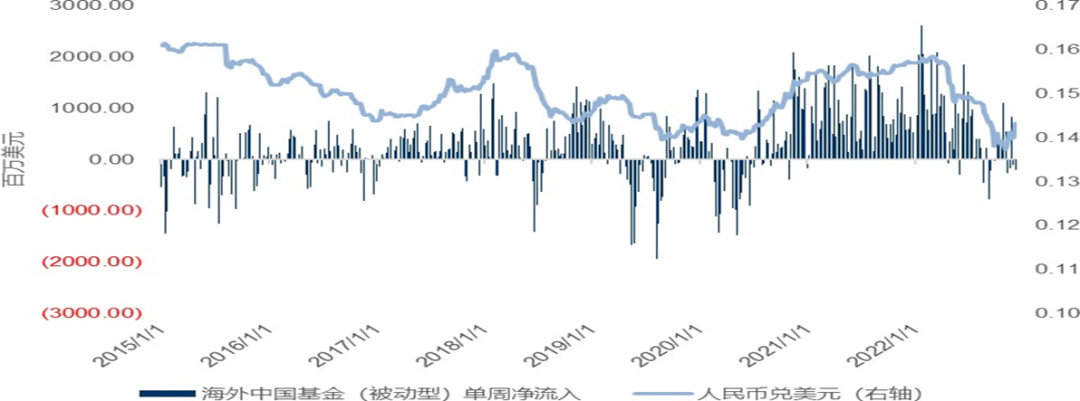
資料來源:EPFR,Wind,申萬宏源研究
估值已從極低水平有所修復,基本面角色更重要
- 11月以來的港股市場反彈,估值修復扮演了更爲重要的角色。
當前港股新經濟行業的整體估值水平基本回到了2022年7月左右的水平,而傳統經濟的估值驅動屬性更爲明顯。
- 展望2023 年在政策預期階段過後,實際的基本面數據將扮演更爲重要的角色。
港股樣本股行業的遠期市盈率,多數行業估值修復非常明顯
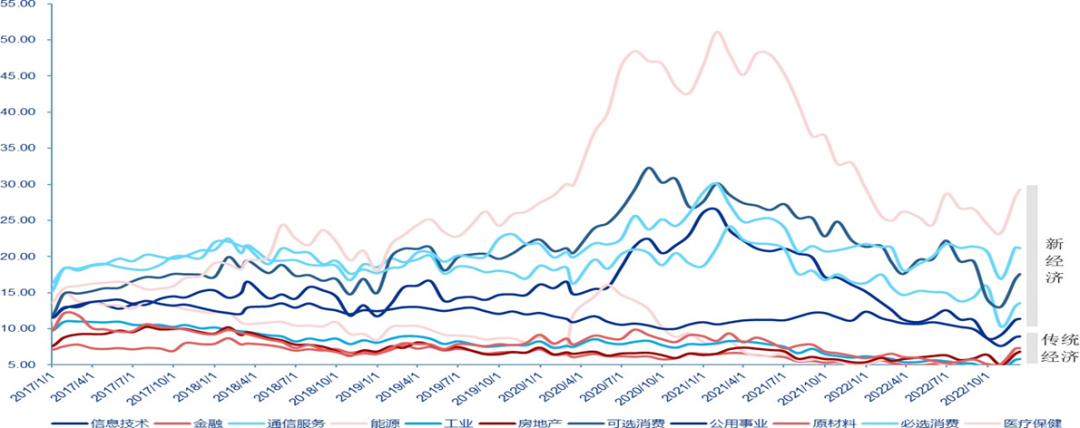
資料來源:Bloomberg,申萬宏源研究
盈利預期的變化
- 從中長期看,港股走勢和盈利預期的調整節奏呈現顯着正相關關係。
- 2022年和2023年的盈利預期下調幅度接近歷史同期低位水平,顯示悲觀預期已經充分計入市場的預期。
- 盈利預期有望基本保持穩定,對市場影響偏中性。
恆生指數歷年預期EPS的上修/下修幅度和節奏,自上一年7月開始計算至本年底
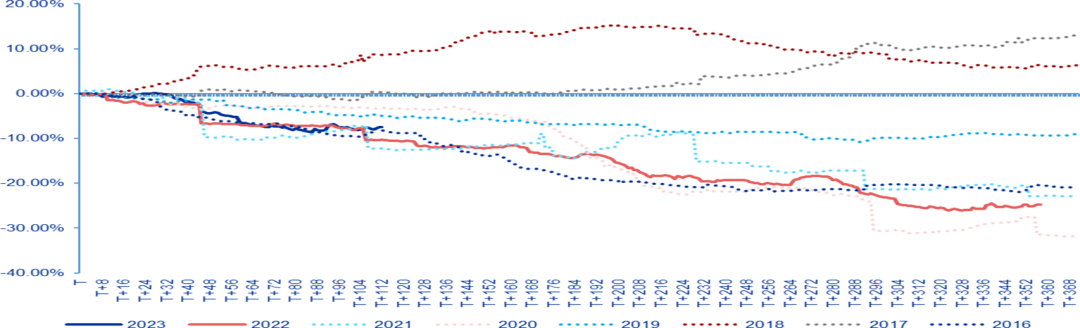
資料來源:Bloomberg,申萬宏源研究;上一年度的7月爲T日,日期按交易日計算流動性反轉有望帶來β機會
外資對中國資產的行業配置呈現了明顯低配:此前被外資重點超配的可選消費 (含大型互聯網公司) 仍處於明顯低配的區間;同時金融行業的配置比例亦出現了大幅下降。
外資對權重板塊的明顯低配是2022年港股指數大幅下挫的原因之一,但在流動性反轉的背景下亦有望帶來β層面的機會。
港股市場和指數的權重板塊 (金融與可選消費) 是外資低配幅度最多的兩個行業
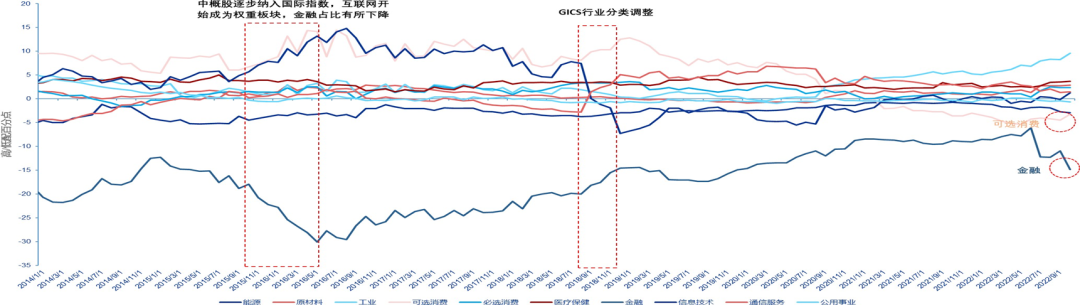
資料來源:EPFR,申萬宏源研究;高/低配幅度計算方式爲主動型基金對行業配置比例-被動基金配置比例
Follow us
Find us on Facebook, Twitter , Instagram, and YouTube or frequent updates on all things investing.Have a financial topic you would like to discuss? Head over to the uSMART Community to share your thoughts and insights about the market! Click the picture below to download and explore uSMART app!

Disclaimers
uSmart Securities Limited (“uSmart”) is based on its internal research and public third party information in preparation of this article. Although uSmart uses its best endeavours to ensure the content of this article is accurate, uSmart does not guarantee the accuracy, timeliness or completeness of the information of this article and is not responsible for any views/opinions/comments in this article. Opinions, forecasts and estimations reflect uSmart’s assessment as of the date of this article and are subject to change. uSmart has no obligation to notify you or anyone of any such changes. You must make independent analysis and judgment on any matters involved in this article. uSmart and any directors, officers, employees or agents of uSmart will not be liable for any loss or damage suffered by any person in reliance on any representation or omission in the content of this article. The content of the article is for reference only and does not constitute any offer, solicitation, recommendation, opinion or guarantee of any securities, virtual assets, financial products or instruments. Regulatory authorities may restrict the trading of virtual asset-related ETFs to only investors who meet specified requirements. Any calculations or images in the article are for illustrative purposes only.
Investment involves risks and the value and income from securities may rise or fall. Past performance is not indicative of future performance. Please carefully consider your personal risk tolerance, and consult independent professional advice if necessary.

More Content

CS Hotline: +852 3018 4526
Trading days: 24 hours | Non-trading days: 9:00-18:00


