


本文來自格隆匯專欄:業談債市 ;作者:楊業偉 張明明
主要觀點
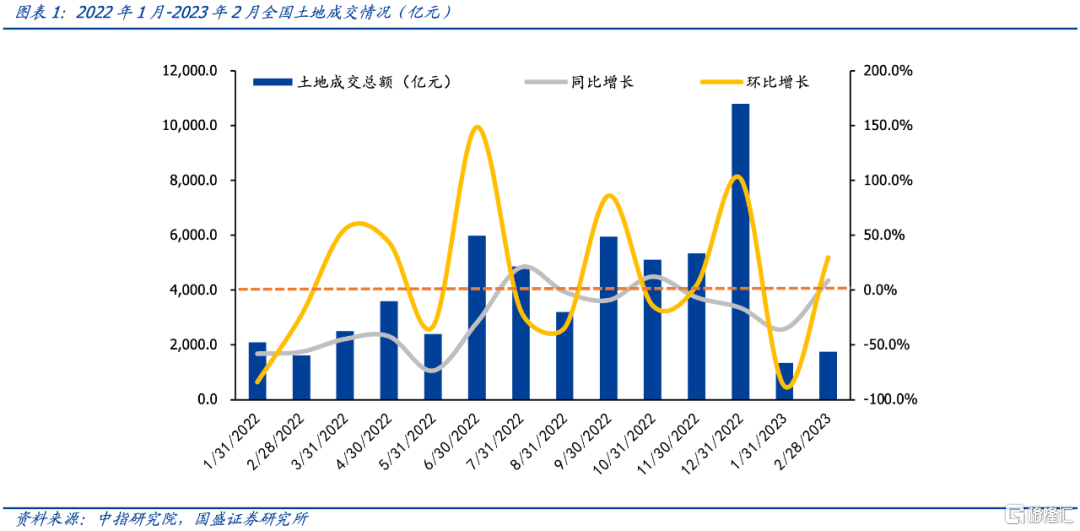
2月份土地市場成交情況同比增加,環比上升。2023年1-2月全國土地成交總額3104.18億元,同比下降16.10%。從2月單月情況來看,2月單月全國土地成交總額1753.99億元,同比增長8.88%,環比上升29.91%。分月份來看,自2022年以來,僅2022年7月、10月和2023年2月土地成交總額較去年同期有所增長,分別同比增長20.84%、12.33%和8.88%。2月土地市場回暖既有市場改善影響,也有春節錯位因素推動,趨勢有待繼續觀察。
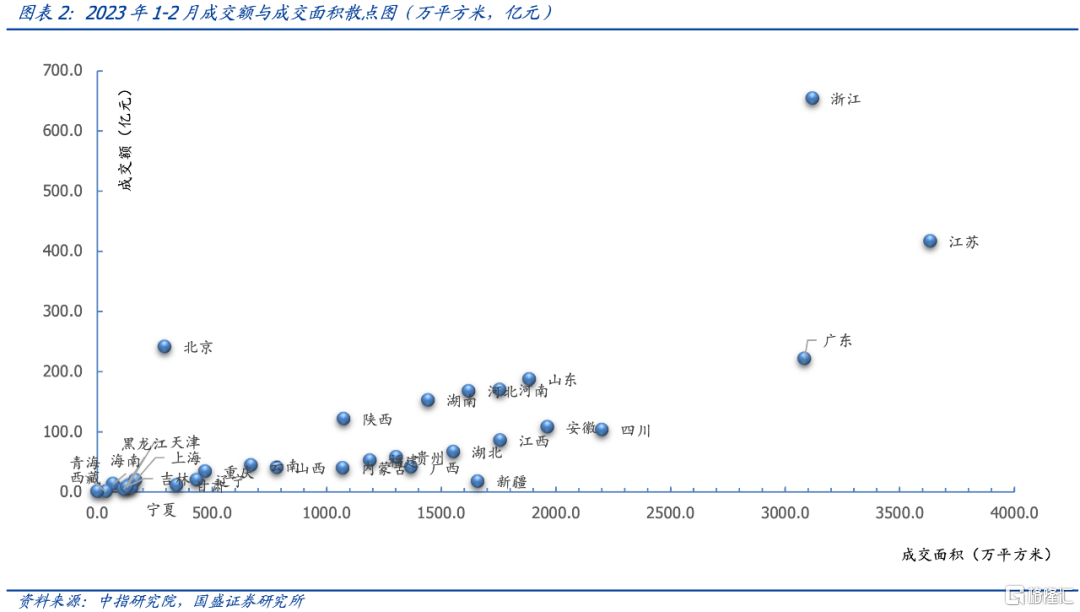
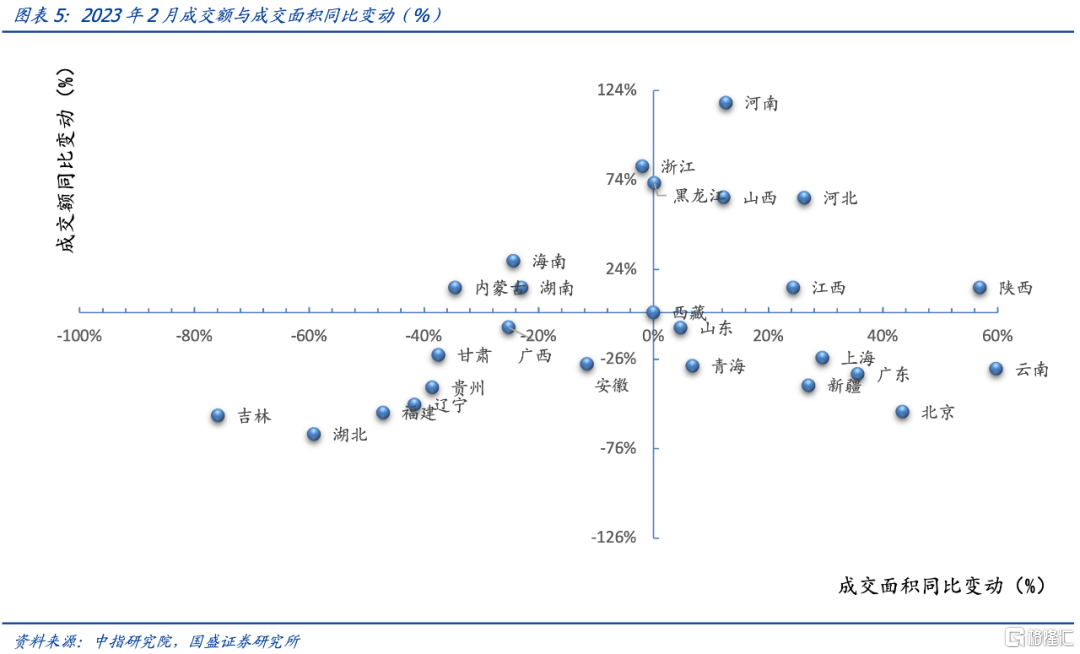
分省份來看,2023年1-2月全國31省份成交額中,12省份同比增加,18省份同比下降。2023年1-2月,全國31省份土地市場中,寧夏、重慶、陝西、內蒙古、廣東、河南、河北、四川、雲南、天津、湖南、江蘇12省成交金額同比上升,西藏未變動,其餘省份同比下降。7個省份跌幅超過50%,降幅前五的省份為青海、吉林、甘肅、海南、上海。從2月單月來看,2月份15個省份較去年2月單月同比成交額為正;2月同比跌幅超過50%的有湖北、吉林、福建、北京、遼寧,分別同比下降68.05%、57.63%、56.13%、55.64%、51.62%。
從各城市土地成交總額來看,2023年1-2月,全國354個土地成交城市中,有133個城市成交額同比增長。成交額25億以上,且升幅前15名分別是深圳、鄭州、石家莊、蘇州、温州、西安、洛陽、紹興、重慶、杭州、岳陽、廣州、徐州、常州、佛山。221個城市成交額同比下跌,去年同期成交額25億以上,降幅前15名分別是威海、蘭州、黃石、合肥、嘉興、寧波、鎮江、海口、漳州、宜春、菏澤、南通、上海、北京、惠州。2月單月,全國331個土地成交城市中,有161個城市成交額同比增長。
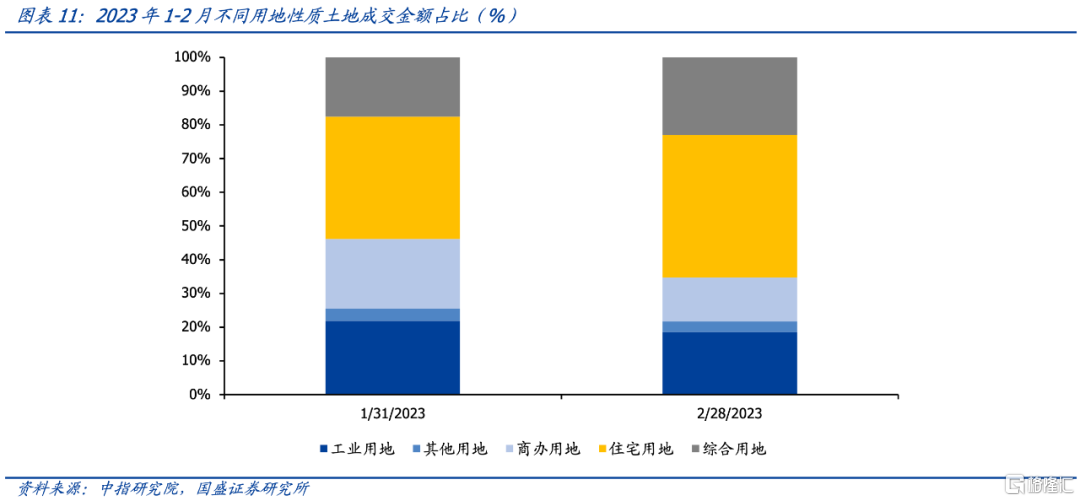
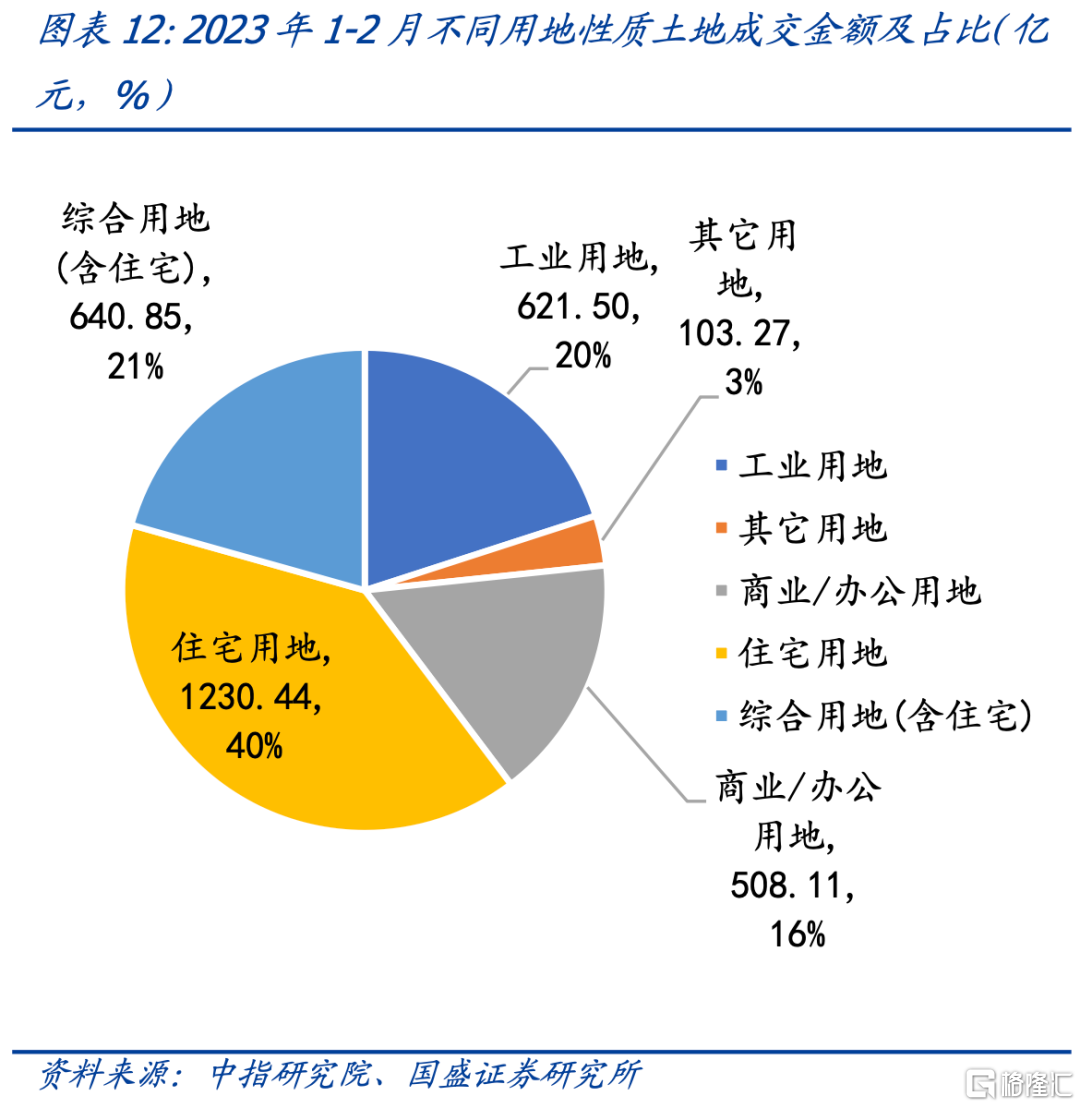
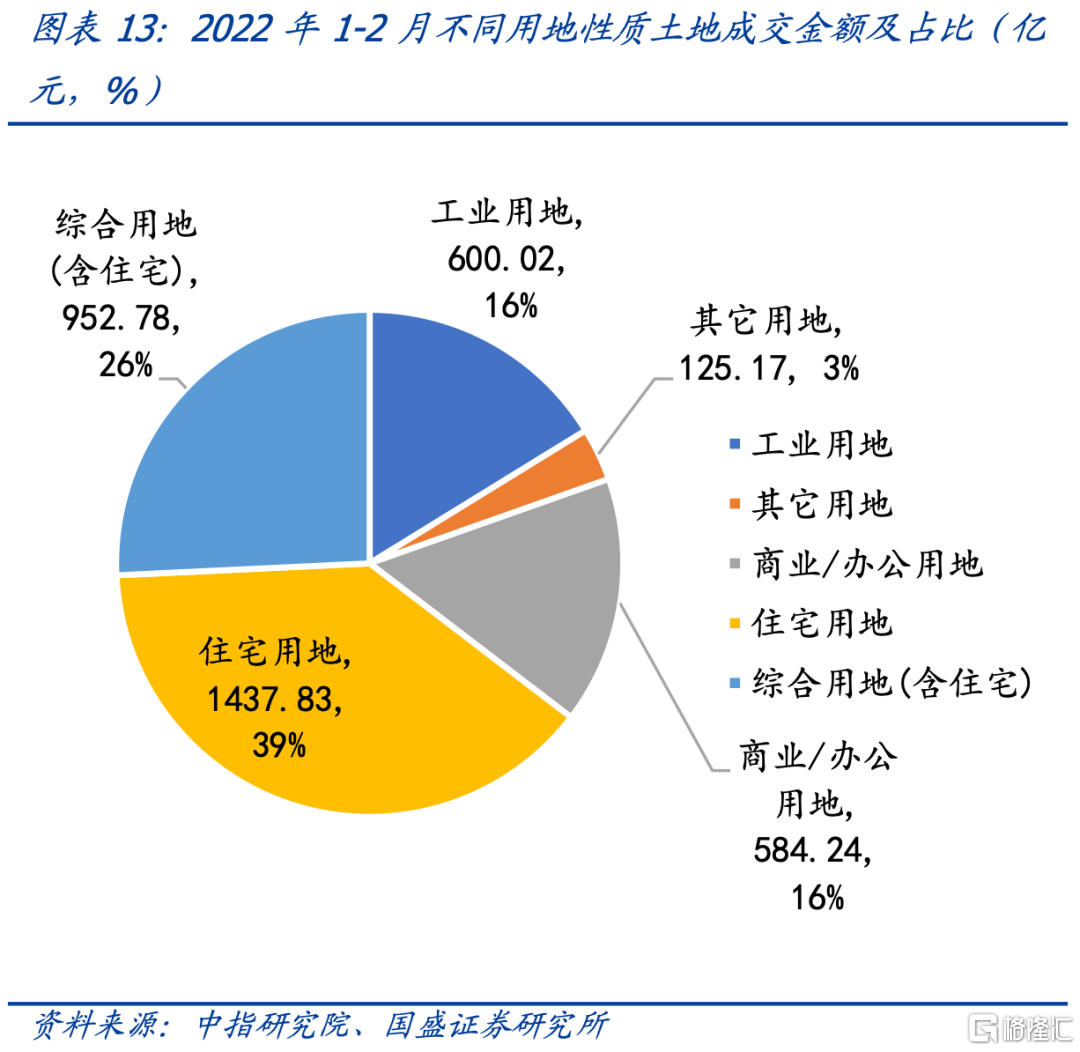
從不同用地性質土地成交總額來看,2023年1-2月,住宅、綜合用地佔比合計超六成。相比去年同期,其他、綜合用地回落,同比分別下降0.06%、5.11%,工業、商業/辦公、住宅用地實現同比增長,較去年同期增長3.81%、0.58%、0.78%。
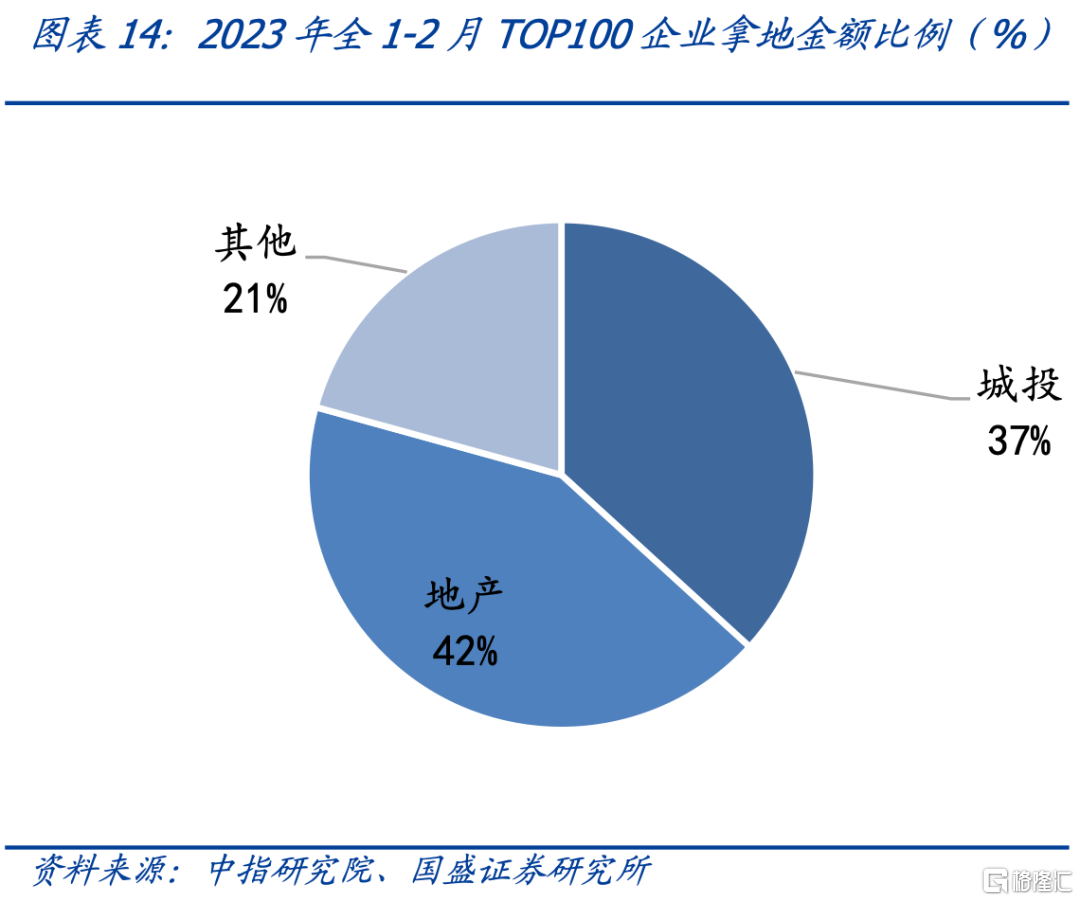
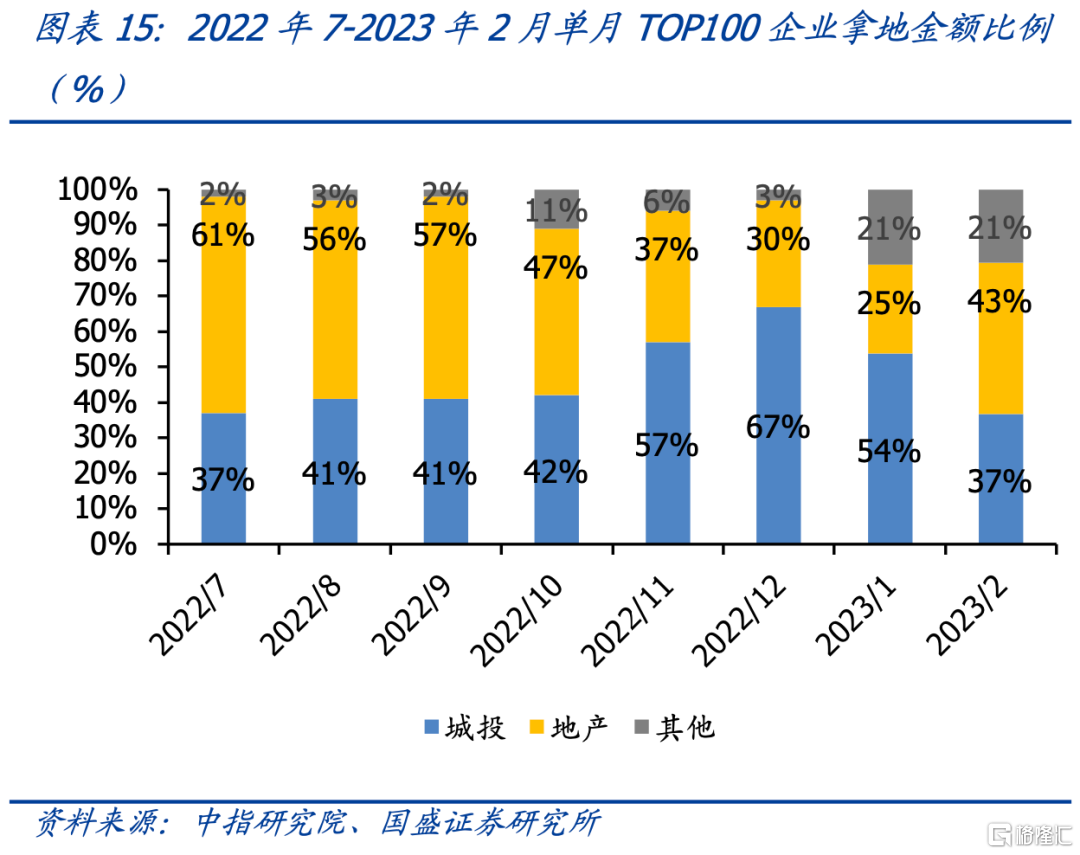
從2023年1-2月TOP100企業拿地情況來看,地產企業拿地佔比42%,城投企業拿地佔比37%,其他類型企業拿地金額佔比21%。而從2022年7月-2023年2月單月情況來看,11、12、1月城投企業拿地金額比例均超過了50%,分別為57%、67%、54%。
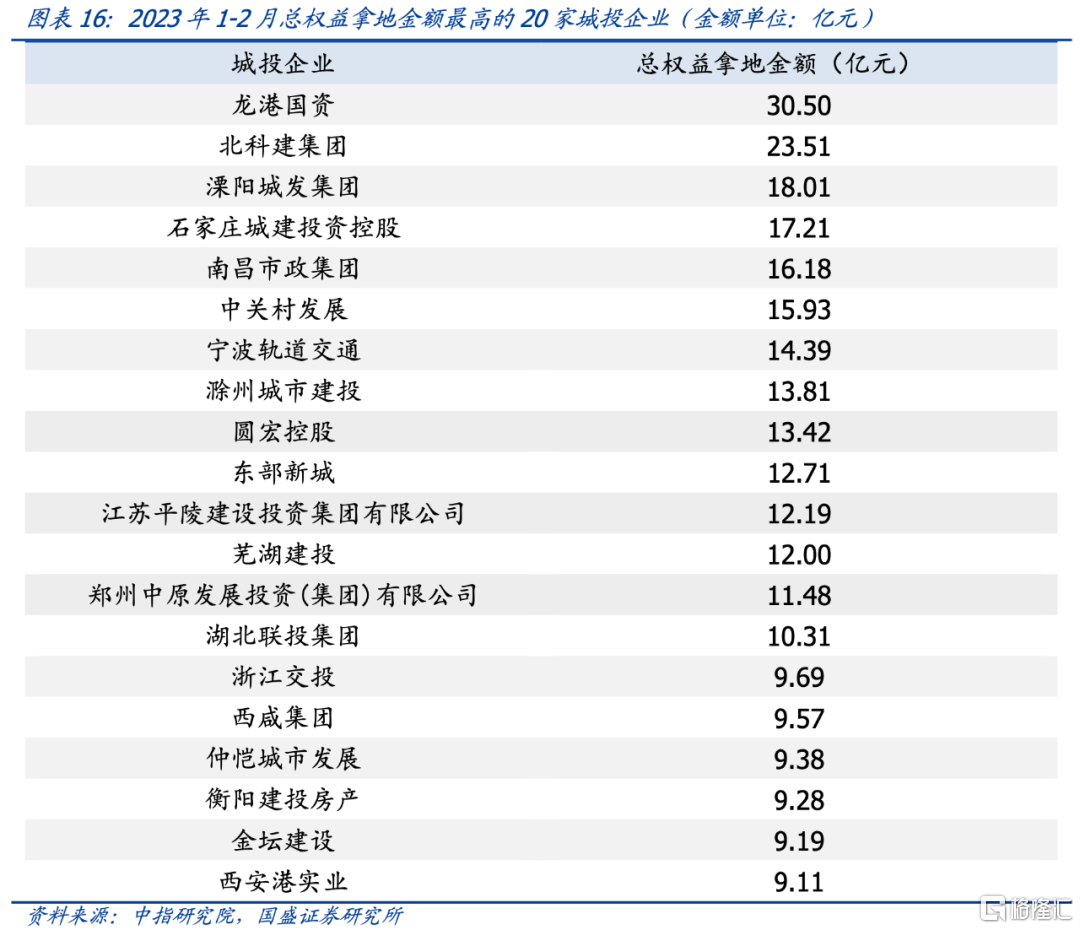
從2023年1-2月TOP100企業中城投企業的拿地情況來看,總權益拿地金額最高的20家城投企業中4家城投企業所在省份為浙江省;4家城投企業所在省份為江蘇省。此外,所在地為北京、安徽、陝西的城投企業各有2家,所在地為河北、江西、河南、湖北、廣東、湖南的城投企業各有1家。
從2023年1-2月TOP100企業中地產企業的拿地情況來看,國有企業、民營企業總權益拿地金額分別為312.23億元 、251.30億元,佔比分別為55%、45%,五成以上為央企國企。國有企業TOP10中,華潤置地、越秀地產、中建三局位列前三。民營企業TOP10中,前三名為廈門坤霖辰房地產投資、廣州市潤川房地產、濱江集團。
風險提示:市場風險超預期、政策邊際變化。
報吿正文
2月份土地市場成交情況同比增加,環比上升。2023年1-2月全國土地成交總額3104.18億元,同比下降16.10%。分月份來看,自2022年以來,僅2022年7月、10月和2023年2月土地成交總額較上一年同期有所增長,分別同比增長20.84%、12.33%和8.88%。從2月單月情況來看,2月單月全國土地成交總額1753.99億元,同比增長8.88%,環比上升29.91%。
分省份來看,2023年1-2月全國31省份成交額中,12省份同比增加,18省份同比下降。2023年1-2月,全國31省份土地市場中,寧夏、重慶、陝西、內蒙古、廣東、河南、河北、四川、雲南、天津、湖南、江蘇12省成交金額同比上升,西藏未變動,其餘省份同比下降。7個省份跌幅超過50%,降幅前五的省份為青海、吉林、甘肅、海南、上海,同比分別下降95.54%、75.53%、71.92%、66.31%、60.37%。

從2月單月來看,2月份15個省份較去年2月單月同比成交額為正,升幅前十名的寧夏、天津、四川、江蘇、重慶、河南、浙江、黑龍江、山西、河北分別同比增長548.74%、267.27%、250.48%、244.31%、184.74%、117.13%、81.56%、72.20%、64.18%、64.01%;2月同比跌幅超過50%的有湖北、吉林、福建、北京、遼寧,分別同比下降68.05%、57.63%、56.13%、55.64%、51.62%。


從各城市土地成交總額來看,2023年1-2月,全國354個土地成交城市中,有133個城市成交額同比增長。成交額25億以上,且升幅前15名分別是深圳、鄭州、石家莊、蘇州、温州、西安、洛陽、紹興、重慶、杭州、岳陽、廣州、徐州、常州、佛山。221個城市成交額同比下跌,去年同期成交額25億以上,降幅前15名分別是威海、蘭州、黃石、合肥、嘉興、寧波、鎮江、海口、漳州、宜春、菏澤、南通、上海、北京、惠州。


從2月各城市土地成交總額來看,全國331個土地成交城市中,有161個城市成交額同比增長。成交額12億以上,且升幅前10名分別是鄭州、蘇州、温州、太原、石家莊、衡陽、宿遷、南充、成都、重慶;170個城市成交額同比下跌,成交額10億以上,降幅前10名分別是黃石、合肥、大連、揚州、珠海、菏澤、遵義、佛山、北京、湖州。


從1-2月不同用地性質土地成交總額來看,2023年1-2月,住宅、綜合用地佔比合計超六成。相比去年同期,其他、綜合用地回落,同比分別下降0.06%、5.11%,工業、商業/辦公、住宅用地實現同比增長,較去年同期增長3.81%、0.58%、0.78%。
從2023年1-2月TOP100企業拿地情況來看,地產企業拿地佔比42%,城投企業拿地佔比37%,其他類型企業拿地金額佔比21%。而從2022年7月-2023年2月單月情況來看,11、12、1月城投企業拿地金額比例均超過了50%,分別為57%、67%、54%;而7-10月、2月城投企業拿地金額比例金額佔比較低,均在半數以下。
從2023年1-2月TOP100企業中城投企業的拿地情況來看,總權益拿地金額最高的20家城投企業如下表所示。其中4家城投企業所在省份為浙江省,總權益拿地金額之和為67.28億元;4家城投企業所在省份為江蘇省,總權益拿地金額之和為52.80億元。此外,所在地為北京、安徽、陝西的城投企業各有2家,所在地為河北、江西、河南、湖北、廣東、湖南的城投企業各有1家。
從2023年1-2月TOP100企業中地產企業的拿地情況來看,國有企業、民營企業總權益拿地金額分別為312.23億元 、251.30億元,佔比分別為55%、45%,五成以上為央企國企。國有企業TOP10中,華潤置地、越秀地產、中建三局,總權益拿地金額分別為102.71億元、59.11億元、29.30億元,位列前三。民營企業TOP10中,前三名的廈門坤霖辰房地產投資有限責任公司、廣州市潤川房地產開發有限公司、濱江集團,總權益拿地金額分別為31.58億元、29.81億元、26.01億元。


風險提示
市場風險超預期、政策邊際變化。
注:本文節選自國盛證券研究所於2023年3月17日發佈的研報《土地市場回暖,城投拿地減少-23M2土地成交數據盤點》


More Content


