光刻膠概念爆發,科創板芯片升超2%
3月9日,半導體、芯片板塊拉昇。截止發稿,容大感光、雙樂股份均20%升停,上海新陽升超11%,同益股份升超10%,彤程新材10%升停,強力新材升超8%,安集科技、芯源微等均升超6%。
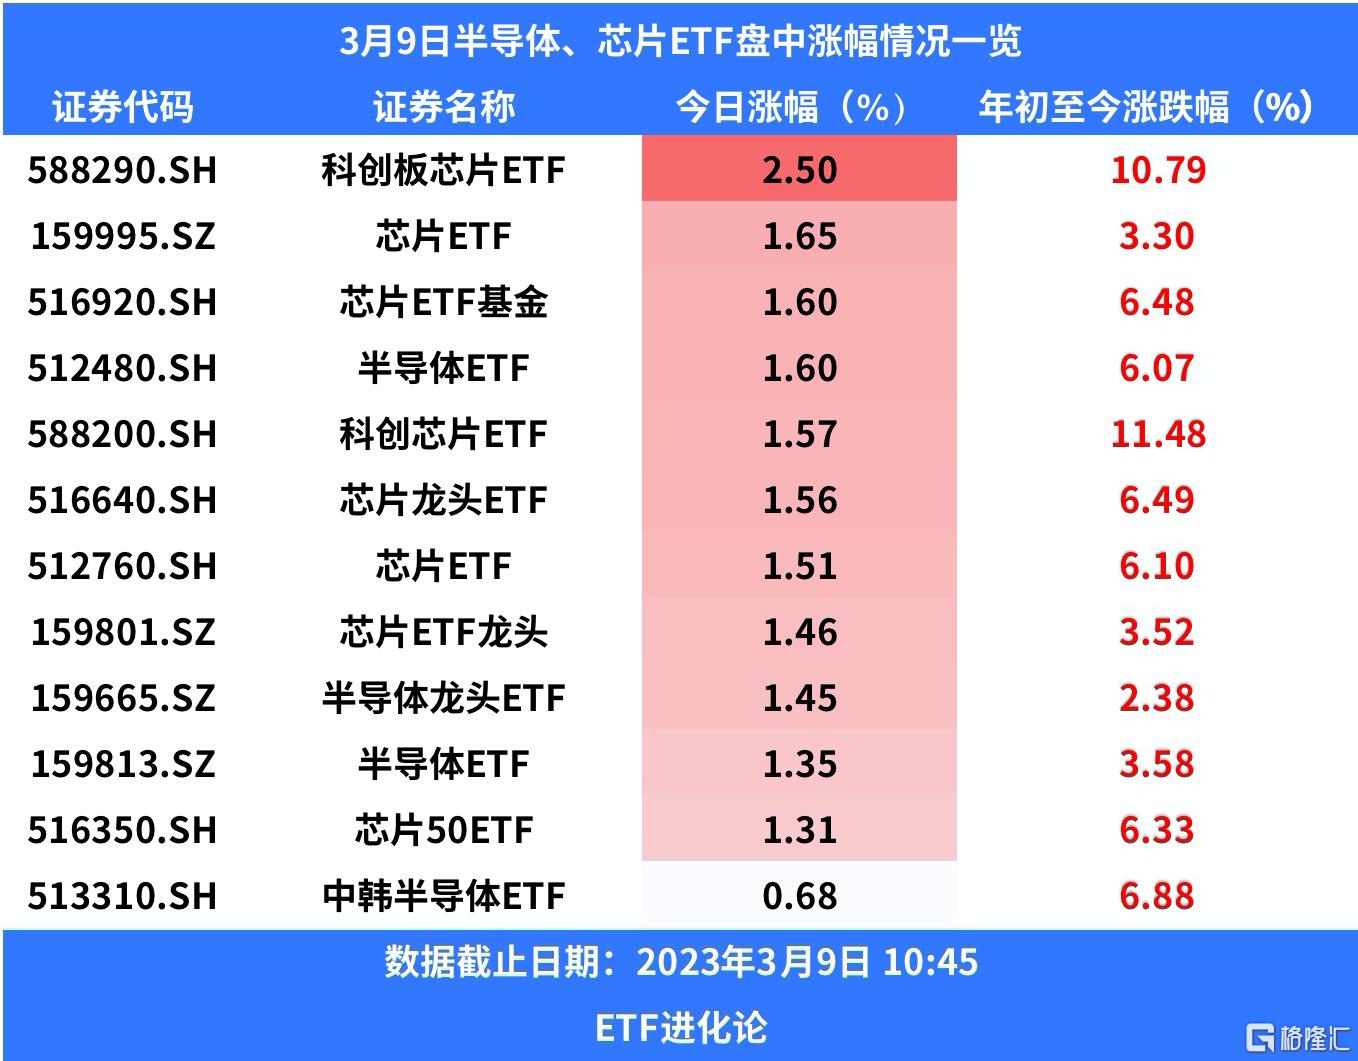
ETF方面,截止今日10:45,科創板芯片ETF升超2%,芯片ETF、芯片ETF基金、半導體ETF、科創芯片ETF、芯片龍頭ETF等紛紛上升。
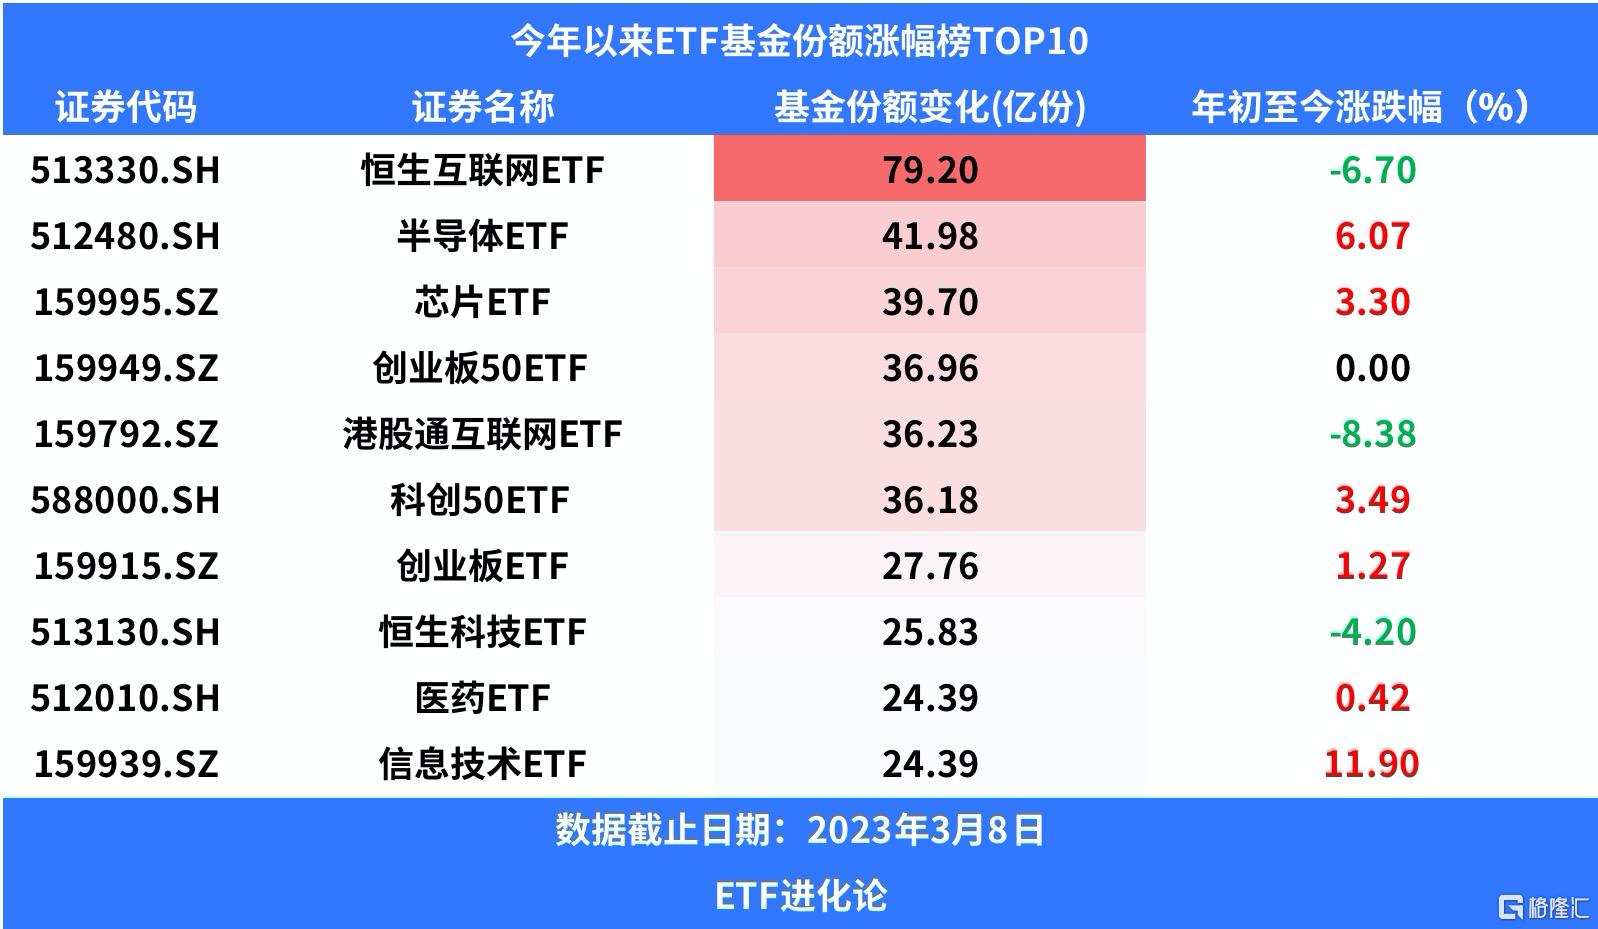
今年以來,半導體ETF和芯片ETF份額大增。截止至3月8日,今年以來,半導體ETF(512480)、芯片ETF(159995)基金份額分別增加41.98億份、39.70億份。
消息面上,容大感光在機構調研時表示,公司的幹膜光刻膠、顯示用光刻膠、半導體光刻膠等產品已經面向市場實現了批量銷售,其中部分產品已進入核心客户的供應鏈體系,公司幹膜光刻膠、顯示用光刻膠、半導體光刻膠等產品的銷售將會是公司未來業績發展的驅動點,未來隨着公司募投項目產能的逐步釋放,公司將迎來新的發展階段。
此外,彤程新材今日強勢升停,公司近日表示,正努力研發上游光刻膠材料,部分光刻膠所用樹脂材料目前已具備自主供應能力。
上海新陽日前表示,公司光刻膠產品已有銷售,主要是在KrF產品。ArF光刻膠尚未實現銷售,該類產品的驗證週期較長,受客户端產線狀態、產品開發進度等多重因素影響,工藝化學材料產品的替代是一個複雜且嚴謹的過程,高端光刻膠產品尤甚,需要多方面的配合協同。
光刻膠是IC製造的核心耗材,技術壁壘極高。根據TECHCET數據,預計2022年全球半導體光刻膠市場規模達到23億美元,同比增長7.5%,2025年超過25億美元。光刻膠行業市場集中度較高,目前全球半導體光刻膠市場基本被日本和美國企業壟斷,其中日本廠商技術和生產規模佔絕對優勢。中國本土光刻膠整體技術水平與國際先進水平存在較大差距,自給率不足10%,其中g線、I線光刻膠的自給率約為20%,KrF光刻膠的自給率不足5%,12英寸硅片用的ArF光刻膠尚無國內企業可以大規模生產。
光刻膠產品按照下游應用領域分為半導體光刻膠(IC光刻膠)、PCB光刻膠、LCD光刻膠。其中,半導體光刻膠技術難度最大,其根據曝光波長分為i線光刻膠(365nm)、KrF光刻膠(248nm)、ArF光刻膠(193nm)等,曝光波長越短,適用IC製程工藝越先進。當前,我國半導體光刻膠市場主要由外資企業壟斷,國產化程度較低。
芯片ETF基金經理趙宗庭表示,消費電子對芯片的需求超過芯片總需求的60%,隨着消費電子需求的日漸復甦,半導體板塊表現也有所回暖。目前庫存指數增速下降顯示半導體芯片行業逐漸步入主動去庫存階段,從佈局節奏上看,2023年一季度、二季度或許是佈局半導體芯片板塊的一個比較好的窗口期。
國海證券表示,近年電子信息產業更新換代速度加快,疊加半導體、顯示面板產業東移,國內光刻膠需求快速提升。
國信證券認為,光刻膠需求趨向高端化,技術壁壘較高。2021年全球光刻膠市場規模約為92億美元,中國光刻膠市場規模約為93.3億元,近5年CAGR值10.9%,保持穩定增長。細分市場高端光刻膠需求膠高。
方正證券表示,在外部限制環境疊加內部發展需求下,國產替代成為當下和未來重要的趨勢之一。2023年全球經濟衰退的風險正在降低,芯片行業預計將迎來持續復甦;新興賽道趨勢延續,新能源芯片等具有較大空間。
浙商證券蔣高振在近期研報中指出,根據SEMI數據顯示,2021年全球半導體光刻膠市場中,中國大陸市場保持最快增速,同比增長43.69%。受益於半導體行業技術進步帶來的KrF膠和ArF膠單價值量和總需求快速提升,預測國內半導體光刻膠市場有望以高於全球的增速持續增長。
Follow us
Find us on
Facebook,
Twitter ,
Instagram, and
YouTube or frequent updates on all things investing.Have a financial topic you would like to discuss? Head over to the
uSMART Community to share your thoughts and insights about the market! Click the picture below to download and explore uSMART app!

Disclaimers
uSmart Securities Limited (“uSmart”) is based on its internal research and public third party information in preparation of this article. Although uSmart uses its best endeavours to ensure the content of this article is accurate, uSmart does not guarantee the accuracy, timeliness or completeness of the information of this article and is not responsible for any views/opinions/comments in this article. Opinions, forecasts and estimations reflect uSmart’s assessment as of the date of this article and are subject to change. uSmart has no obligation to notify you or anyone of any such changes. You must make independent analysis and judgment on any matters involved in this article. uSmart and any directors, officers, employees or agents of uSmart will not be liable for any loss or damage suffered by any person in reliance on any representation or omission in the content of this article. The content of the article is for reference only and does not constitute any offer, solicitation, recommendation, opinion or guarantee of any securities, virtual assets, financial products or instruments. Regulatory authorities may restrict the trading of virtual asset-related ETFs to only investors who meet specified requirements. Any calculations or images in the article are for illustrative purposes only.
Investment involves risks and the value and income from securities may rise or fall. Past performance is not indicative of future performance. Please carefully consider your personal risk tolerance, and consult independent professional advice if necessary.


