隆揚電子登陸創業板,股價跌超10%破發!
10月31日,隆揚電子(崑山)股份有限公司(以下簡稱:隆揚電子)於創業板上市,其發行定價22.50元/股,對應33.63倍市盈率,在可比上市公司中高於達瑞電子,與世華科技市盈率較為接近。
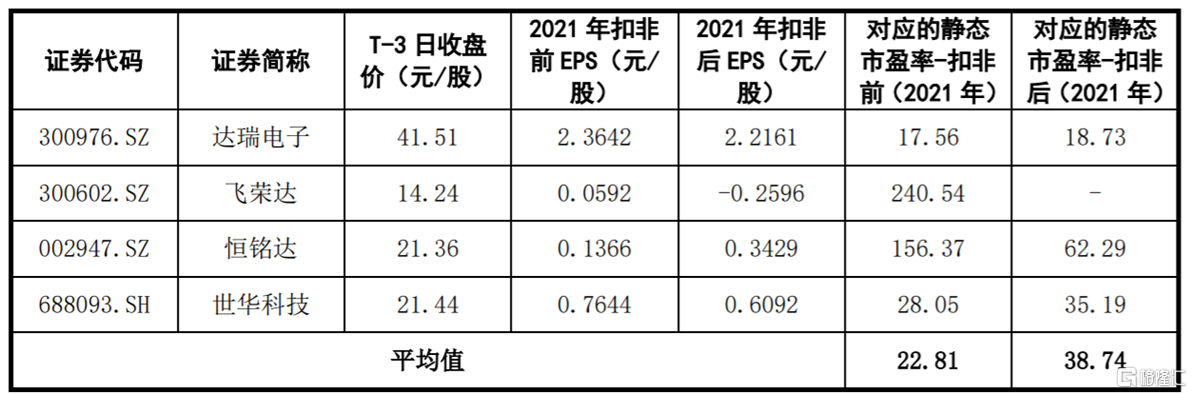
(可比上市公司的市盈率水平,Wind 資訊,數據截至2022年10月11日(T-3日))
上市首日,N隆揚(301389.SZ)大幅低開,盤中一度跌至19.91元/股,較發行價下跌超10%,最新總市值約56.8億元。
截至發行前,隆揚國際直接持有公司92.05%的股份,為直接控股股東;鼎炫控股直接持有隆揚國際100%的股份,通過隆揚國際間接持有公司92.05%的股份,為間接控股股東;傅青炫與張東琴夫婦通過直接、間接的方式合計持有鼎炫控股71.55%的股份,為實際控制人,且二人為中國台灣籍。
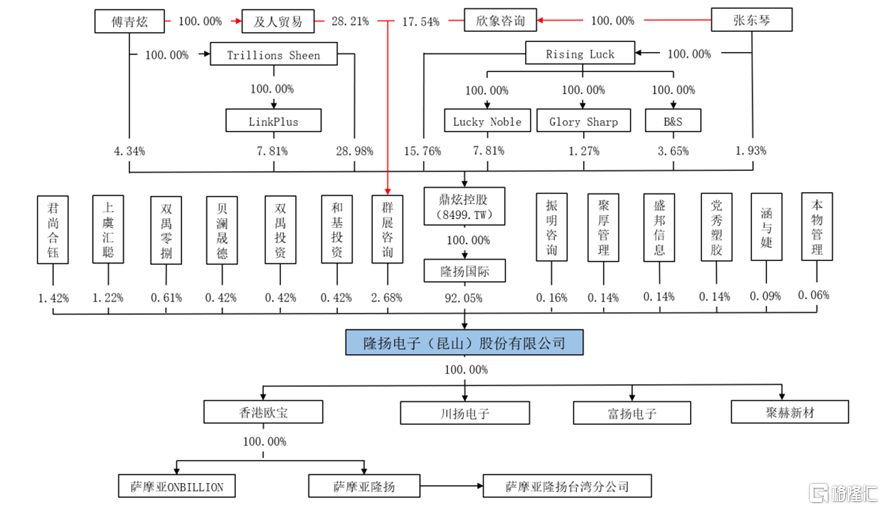
(股權結構圖,招股書)
隆揚電子是一家電磁屏蔽材料專業製造商,主要從事電磁屏蔽材料的研發、生產和銷售,產品主要包括導電布、導電布膠帶、屏蔽絕緣複合膠帶、吸波材料、導電布泡棉、全方位導電海綿、SMT 導電泡棉等。同時,公司也從事部分絕緣材料的研發、生產和銷售。
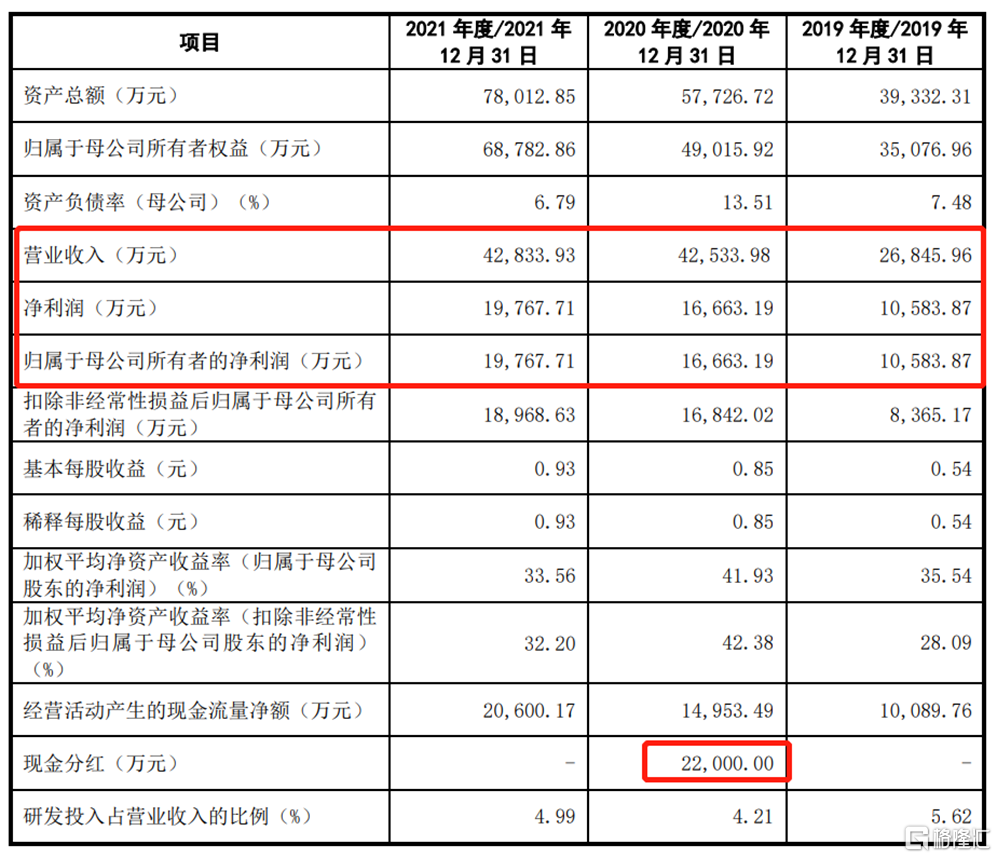
2019年-2021年,公司的營業收入分別為2.68億元、4.25億元和4.28億元,相應的歸母淨利潤分別為1.06億元、1.67億元和1.98億元,2020年公司分紅2.2億元。

(主要財務指標,招股書)
分產品看,公司的主要收入來源為電磁屏蔽材料中的導電泡棉,其佔比超過50%,而導電布及膠帶、絕緣材料產品收入佔比均在20%左右。
報吿期內,公司主營業務毛利率分別為57.28%、65.73%及63.25%。2020年度主營業務毛利率同比增加8.45%,2021年度主營業務毛利率同比下降2.48%,主要受各產品毛利率及其相對收入規模變化的共同影響所致。
整體來看,公司綜合毛利率水平與世華科技較為接近,高於其他可比上市公司。
(公司綜合毛利率與同行業公司對比情況,招股書)
報吿期內,公司最終應用於蘋果公司的產品和服務收入佔主營業務收入的比例分別為66.37%、72.53%及70.32%,佔比較高,公司產品收入對蘋果公司存在重大依賴。
近年來,3C行業特別是筆記本電腦領域,因用户滲透率趨於飽和導致產品出貨速度放緩。若未來下游行業的市場需求出現下降或終端應用產品的銷量不及預期,公司產品的市場需求將下滑,從而對公司經營業績產生不利影響。
事實上,市場需求的下降已經體現在公司的業績上。隆揚電子表示,預計2022年1-9月可實現的營業收入區間為2.9億元至3.2億元,同比變動-6.81%至2.83%;歸母淨利潤預計為1.3億元至 1.5億元,同比變動-13.04%至0.33%。
Follow us
Find us on
Facebook,
Twitter ,
Instagram, and
YouTube or frequent updates on all things investing.Have a financial topic you would like to discuss? Head over to the
uSMART Community to share your thoughts and insights about the market! Click the picture below to download and explore uSMART app!

Disclaimers
uSmart Securities Limited (“uSmart”) is based on its internal research and public third party information in preparation of this article. Although uSmart uses its best endeavours to ensure the content of this article is accurate, uSmart does not guarantee the accuracy, timeliness or completeness of the information of this article and is not responsible for any views/opinions/comments in this article. Opinions, forecasts and estimations reflect uSmart’s assessment as of the date of this article and are subject to change. uSmart has no obligation to notify you or anyone of any such changes. You must make independent analysis and judgment on any matters involved in this article. uSmart and any directors, officers, employees or agents of uSmart will not be liable for any loss or damage suffered by any person in reliance on any representation or omission in the content of this article. The content of the article is for reference only and does not constitute any offer, solicitation, recommendation, opinion or guarantee of any securities, virtual assets, financial products or instruments. Regulatory authorities may restrict the trading of virtual asset-related ETFs to only investors who meet specified requirements. Any calculations or images in the article are for illustrative purposes only.
Investment involves risks and the value and income from securities may rise or fall. Past performance is not indicative of future performance. Please carefully consider your personal risk tolerance, and consult independent professional advice if necessary.


