


本文來自格隆匯專欄:中金研究,作者: 嚴佳卉 侯德凱
業績回顧
1H22業績符合我們預期
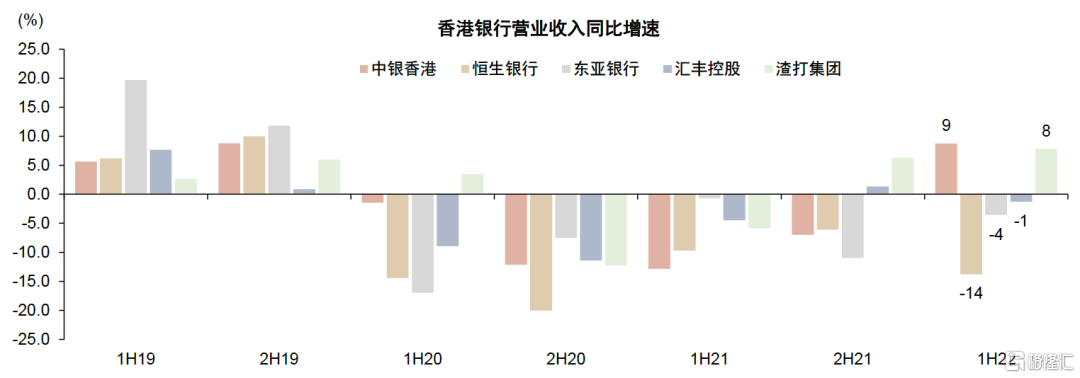
1H22香港銀行(中銀香港、匯豐、渣打、恆生、東亞)營收同比增長0.5%,歸母淨利潤同比增長4.5%,符合我們預期。其中,中銀香港、匯豐控股、渣打集團歸母淨利潤同比高單位數正增長,主要得益於息差走闊及非息收入表現良好,恆生銀行和東亞銀行則同比減少46.3%和43.9%,主要來自內房風險暴露導致信用成本大幅上升。
發展趨勢
市場利率大幅上升,息差改善進行時。上半年1M LIBOR與1M HIBOR分別上升169bp和71bp,LIBOR上行領先於HIBOR,因此境外業務較多的匯豐和渣打息差環比提升幅度較以香港本地經營為主的中銀香港、恆生、東亞更加明顯。展望下半年,我們預計HIBOR將滯後於LIBOR進一步上行,銀行間總結餘收窄,推動香港銀行息差改善,其中香港本地銀行息差彈性或大於國際銀行。
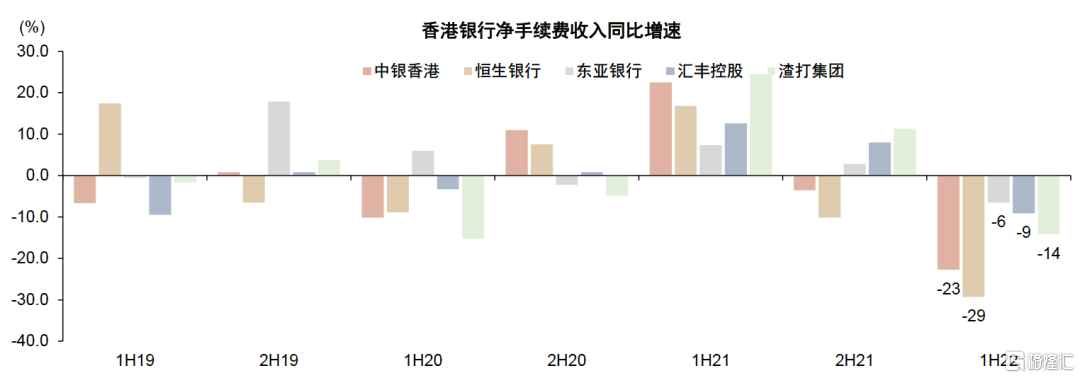
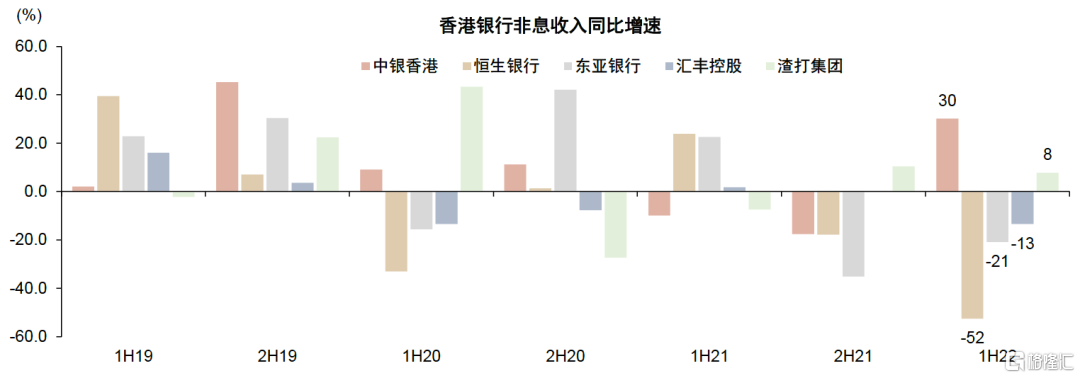
非息收入波動幅度較大。1H22香港銀行手續費收入同比減少14.2%,主要原因是資本市場低迷導致證券經紀、基金代銷等收入大幅減少。其他非息收入波動較大,投資收益與保險資產虧損等因素致各家銀行表現迥異,中銀香港和渣打表現相對較好。
信用成本大幅走高,內房敞口成關注焦點。1H22香港銀行撥備計提環比增長117%,風險主要來自衰退預期與內房敞口兩方面。1)匯豐、渣打兩家國際銀行2021年回撥疫情撥備產生低基數效應,今年以來隨着通脹持續惡化、衰退預期增強,各家銀行均調整模型假設參數,增提撥備。2)內房敞口風險暴露,由於中銀香港78%敞口為國企客户,資產質量穩健,而恆生、東亞內房敞口不良率顯著走高,我們預計2H22內房敞口仍存在較大不確定性,風險暴露較大的銀行或將持續面臨撥備計提壓力。
風險
利率上升不及預期,內房敞口和海外衰退風險進一步暴露。
正文
1H22業績彙總
圖表1:香港銀行淨利息收入同比增速

資料來源:公司公吿,中金公司研究部
注:中銀香港淨利息收入為未經調整口徑,將外匯掉期工具產生的投資收益計入利息收入後,淨利息收入同比增速為8.7%
圖表2:香港銀行淨手續費收入同比增速
資料來源:公司公吿,中金公司研究部
圖表3:香港銀行非息收入同比增速
資料來源:公司公吿,中金公司研究部
圖表4:香港銀行營業收入同比增速
資料來源:公司公吿,中金公司研究部
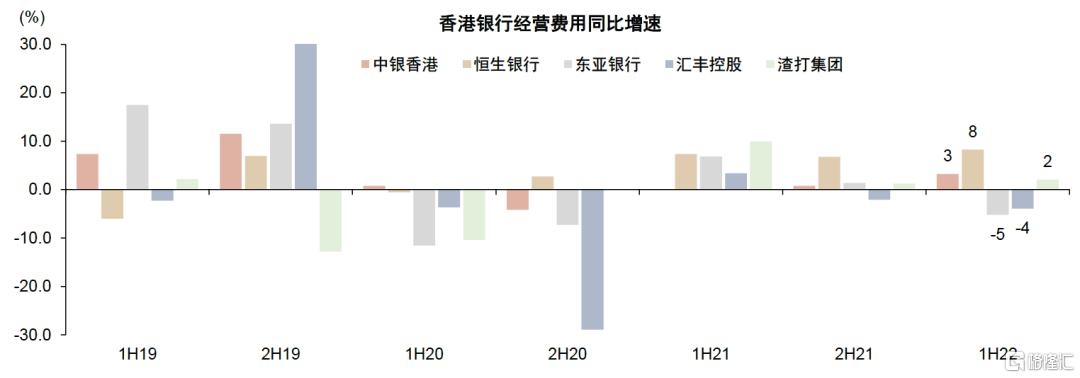
圖表5:香港銀行經營費用同比增速
資料來源:公司公吿,中金公司研究部
圖表6:香港銀行撥備前利潤同比增速
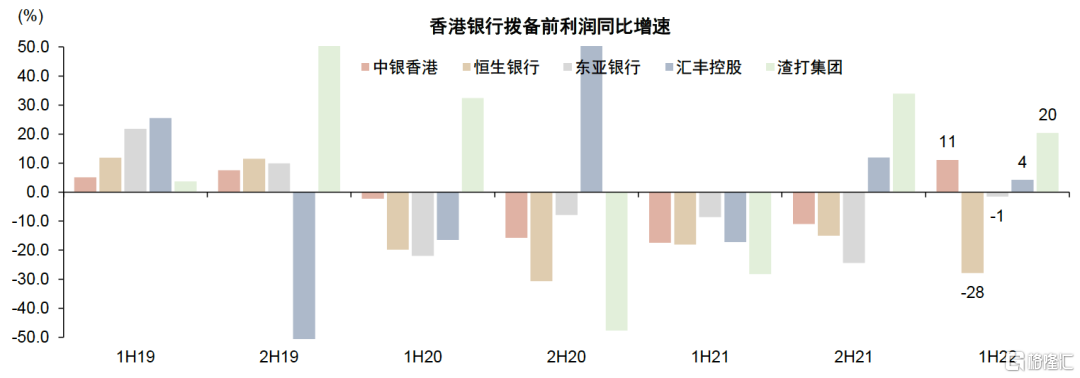
資料來源:公司公吿,中金公司研究部
圖表7:香港銀行淨利潤同比增速

資料來源:公司公吿,中金公司研究部
圖表8:香港銀行淨息差

資料來源:公司公吿,中金公司研究部
注:中銀香港淨息差為調整後口徑,將外匯掉期工具產生的投資收益計入利息收入
圖表9:香港銀行信用成本

資料來源:公司公吿,中金公司研究部
圖表10:香港銀行總資產同比增速
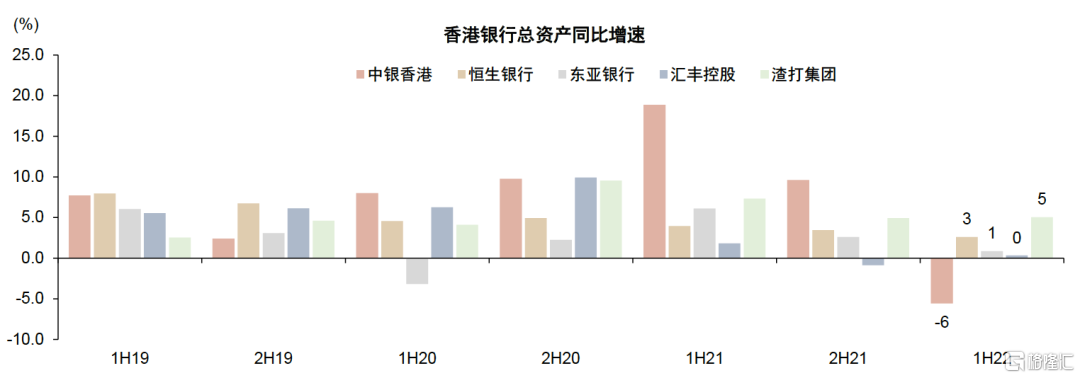
資料來源:公司公吿,中金公司研究部
注:1H21中銀香港由於IPO影響致貸款及存款餘額較高,1H22同比受高基數因素影響
圖表11:香港銀行客户貸款餘額同比增速
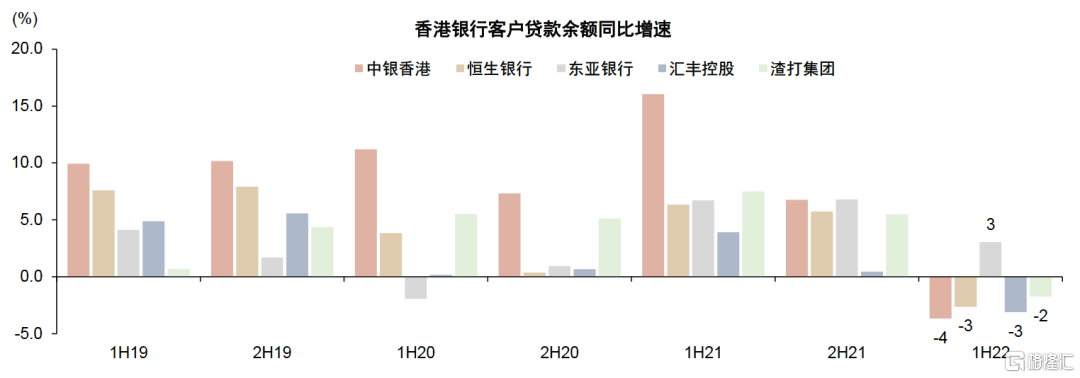
資料來源:公司公吿,中金公司研究部
注:1H21中銀香港由於IPO影響致貸款及存款餘額較高,1H22同比受高基數因素影響
圖表12:香港銀行客户存款餘額同比增速
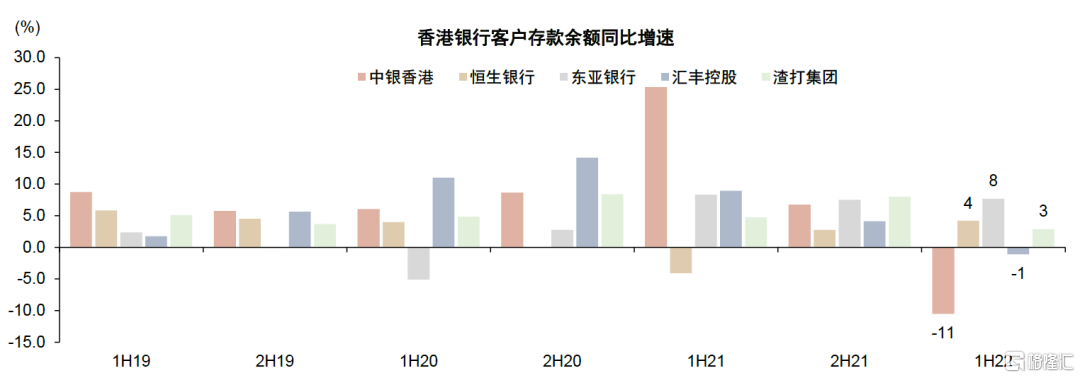
資料來源:公司公吿,中金公司研究部
注:1H21中銀香港由於IPO影響致貸款及存款餘額較高,1H22同比受高基數因素影響
圖表13:香港銀行核心一級資本充足率健康,匯豐與渣打資本盈餘水平相對較低
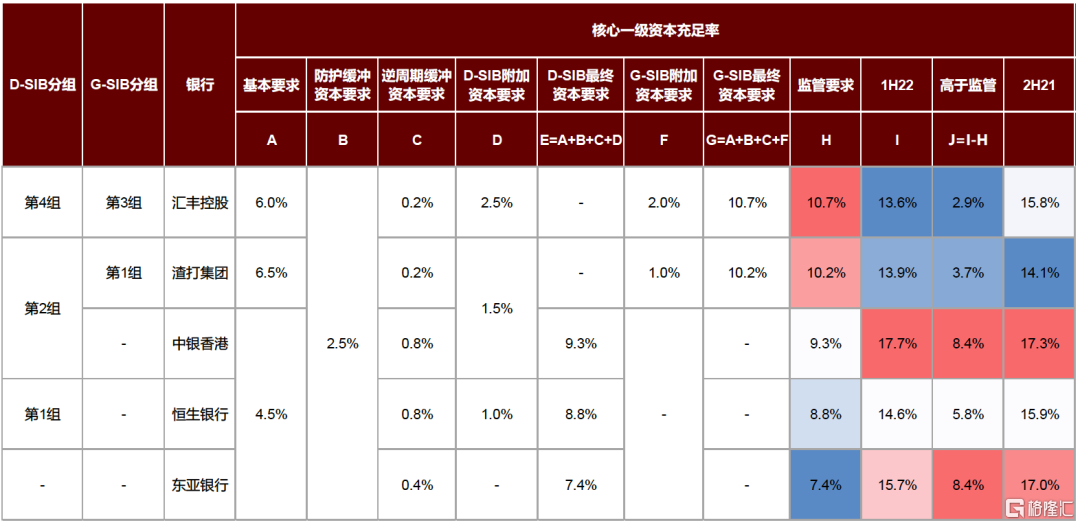
資料來源:香港金管局,公司公吿,中金公司研究部
資產質量及內房敞口風險
圖表14:東亞銀行大陸對公地產集中度較高
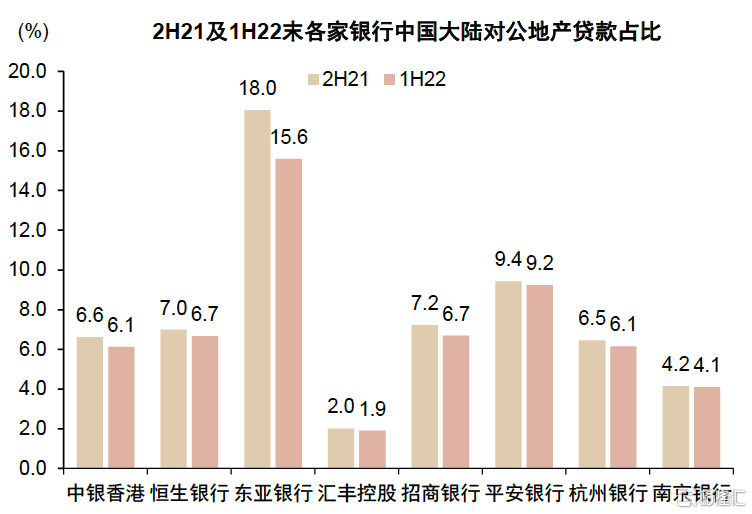
資料來源:公司公吿,中金公司研究部(注:恆生銀行、東亞銀行、匯豐控股大陸對公地產敞口包括其他信用工具)
圖表15:現階段恆生銀行內房敞口暴露較大風險
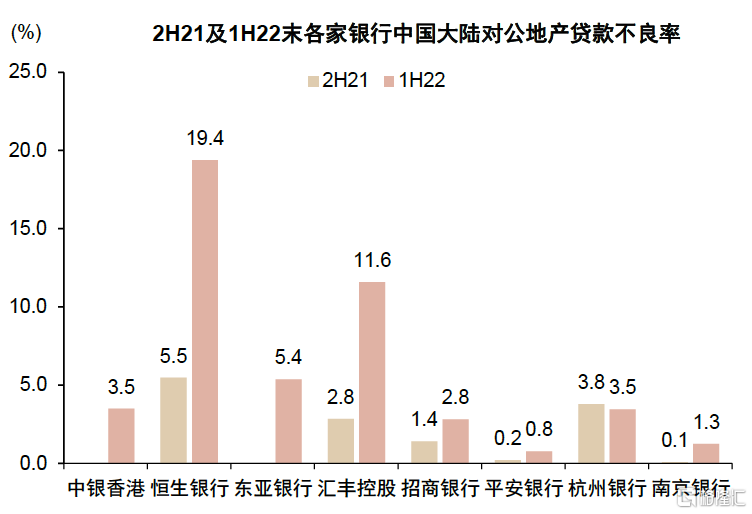
資料來源:公司公吿,中金公司研究部
注:恆生銀行、東亞銀行、匯豐控股大陸對公地產敞口包括其他信用工具
圖表16:地產敞口撥貸比樣本中資銀行顯著更高
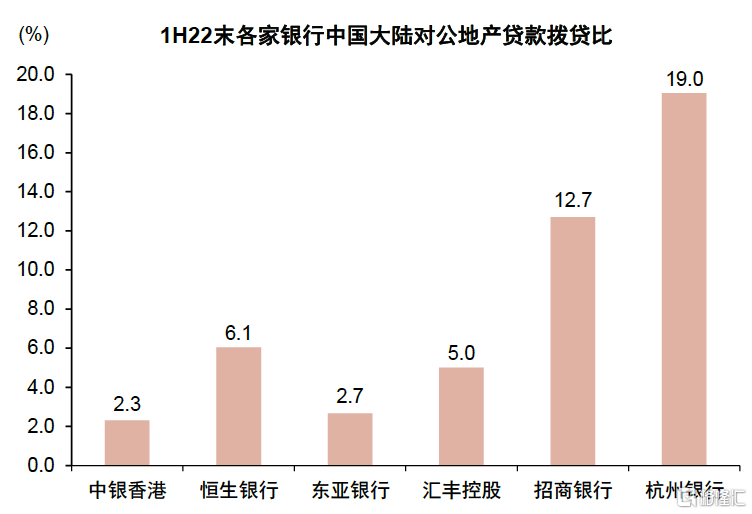
資料來源:公司公吿,中金公司研究部
注:恆生銀行、東亞銀行、匯豐控股大陸對公地產敞口包括其他信用工具
圖表17:地產敞口撥備覆蓋率樣本中資銀行顯著更高

資料來源:公司公吿,中金公司研究部
注:恆生銀行、東亞銀行、匯豐控股大陸對公地產敞口包括其他信用工具
圖表18:中銀香港國企客户佔比高,內房敞口風險較小
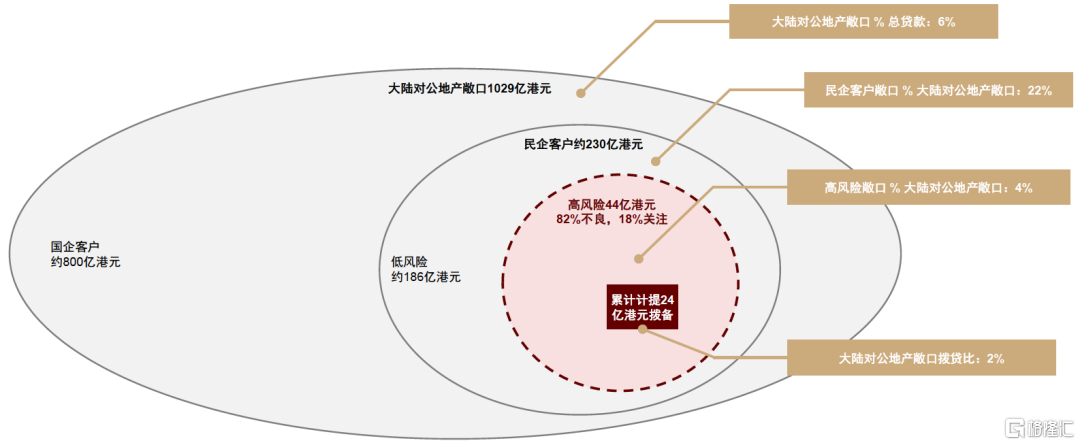
資料來源:公司公吿,中金公司研究部
圖表19:恆生銀行1H22中國大陸對公地產“高風險”敞口占比約33%

資料來源:公司公吿,中金公司研究部
注:恆生銀行大陸對公地產敞口包括其他信用工具
圖表20:東亞銀行1H22中國大陸對公地產“高風險”敞口占比約16%

資料來源:公司公吿,中金公司研究部
注:東亞銀行大陸對公地產敞口包括其他信用工具
圖表21:香港銀行貸款信用成本穩定在較低水平
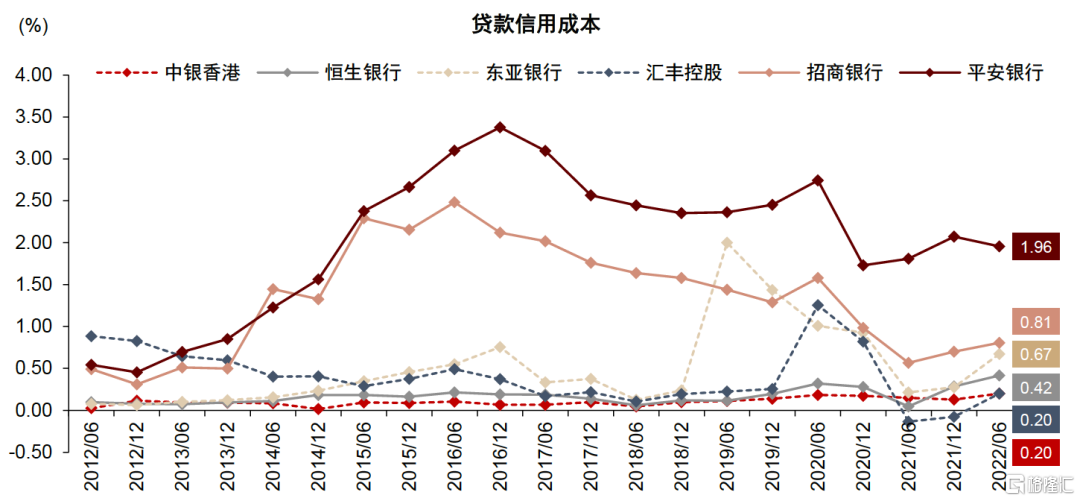
資料來源:公司公吿,中金公司研究部
圖表22:香港銀行撥貸比低於中資銀行
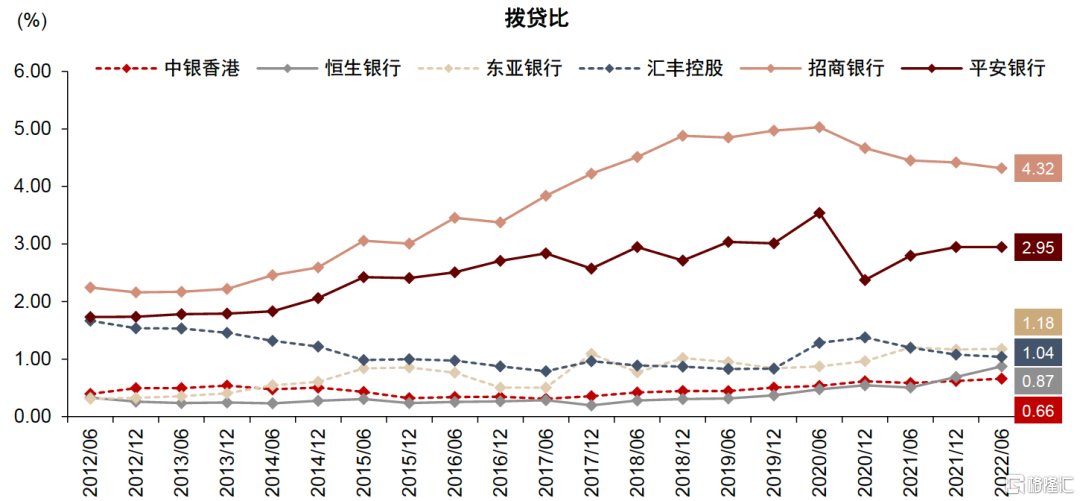
資料來源:公司公吿,中金公司研究部
圖表23:過去一年香港銀行不良率攀升主要來自內房敞口風險暴露

資料來源:公司公吿,中金公司研究部
圖表24:香港銀行撥備覆蓋率
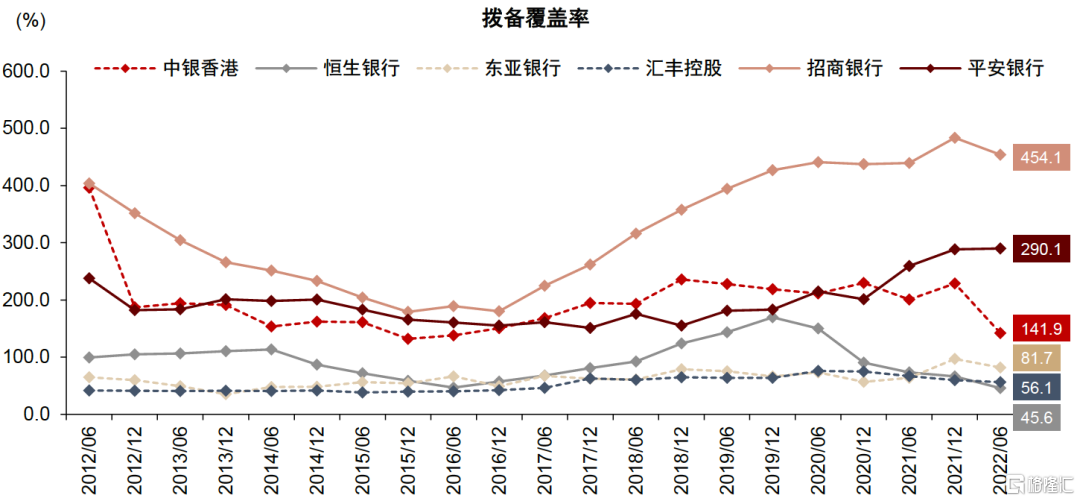
資料來源:公司公吿,中金公司研究部
圖表25:各家銀行不良貸款認定對比

資料來源:公司公吿,香港金管局,BIS,中金公司研究部
宏觀經濟觀測
圖表26:香港2Q22實際GDP同比減少1.3%

資料來源:Wind,中金公司研究部
圖表27:香港7月通脹率繼續回升至1.9%
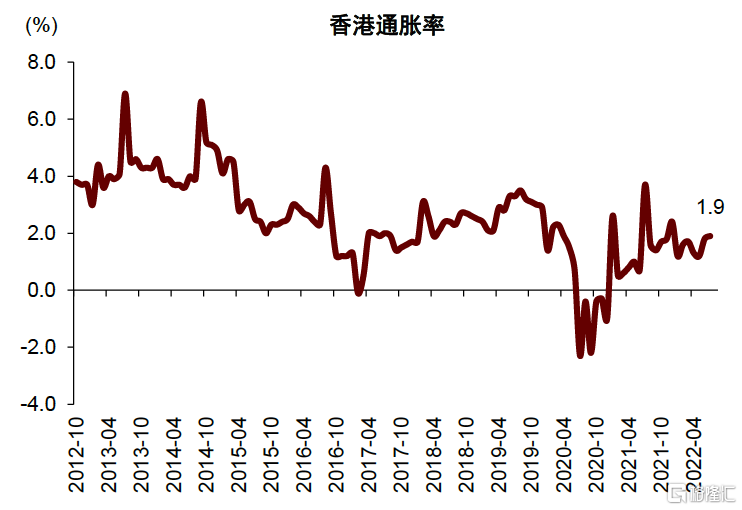
資料來源:Wind,中金公司研究部
圖表28:香港8月製造業PMI環比回落
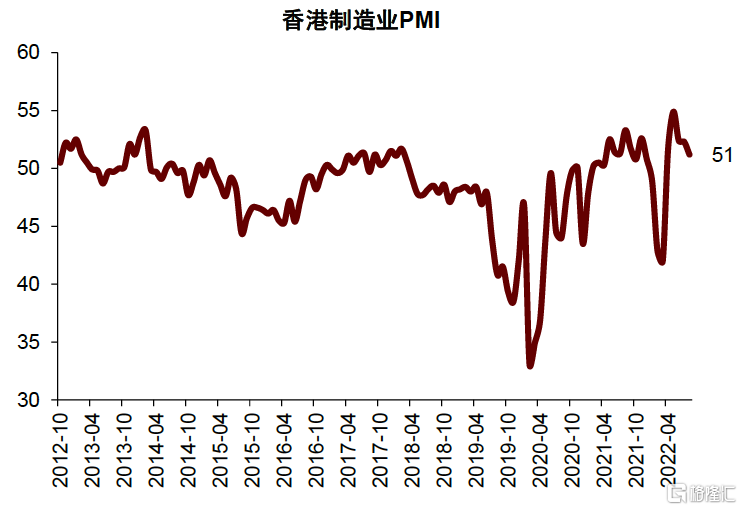
資料來源:Wind,中金公司研究部
圖表29:香港7月失業率降至4.3%
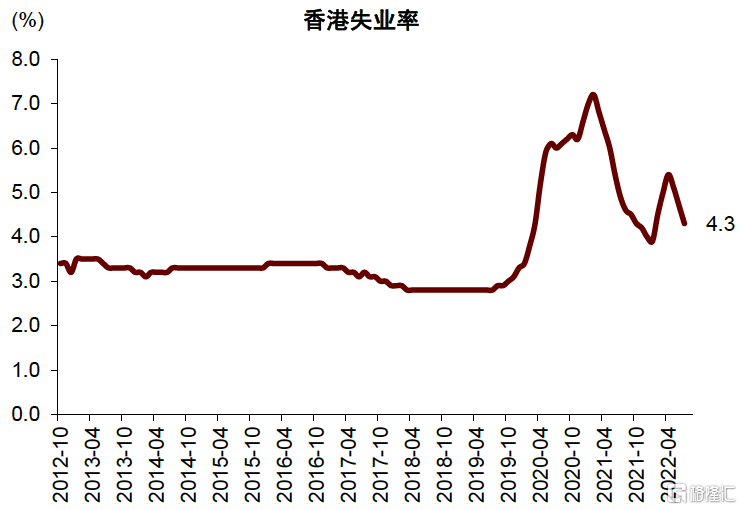
資料來源:Wind,中金公司研究部
圖表30:香港進出口持續走弱

資料來源:Wind,中金公司研究部
圖表31:三季度以來香港樓價持續下行
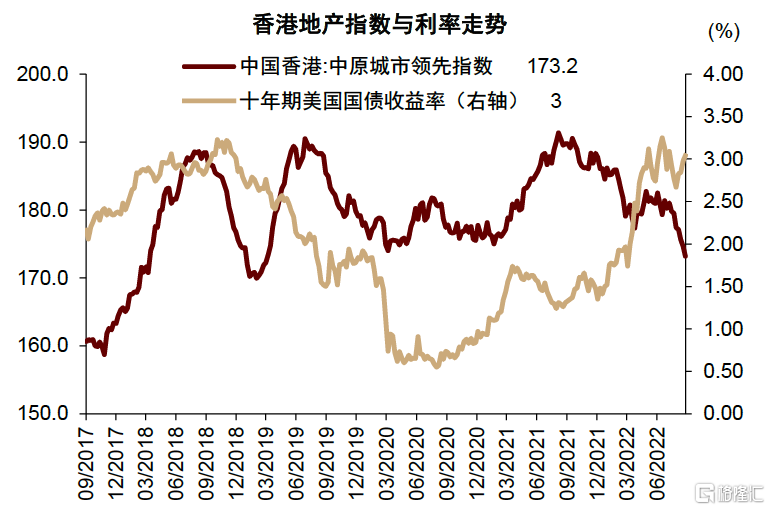
資料來源:Centaline,Wind,中金公司研究部
圖表32:香港匯率仍處在弱方兑換保證附近
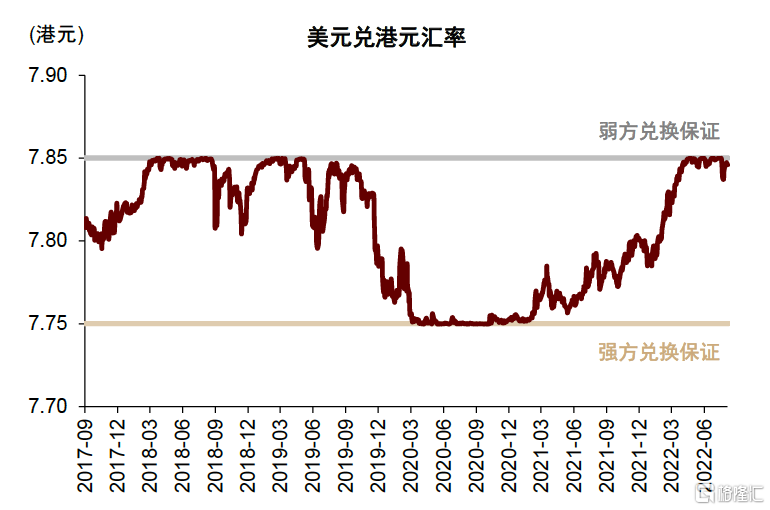
資料來源:Wind,中金公司研究部
圖表33:8月末,香港銀行間總結餘收窄至1250億港元
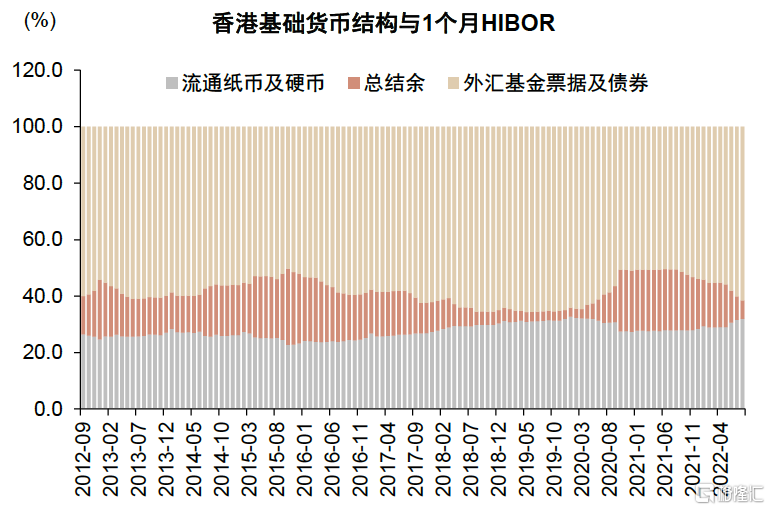
資料來源:Wind,中金公司研究部
圖表34:截至1H22末,香港銀行業貸款較年初增速僅為0.83%,信貸需求較弱

資料來源:CEIC,香港金管局,中金公司研究部
圖表35:截至1H22末,香港銀行業存款較年初減少1.1%,主要原因是利率上升、流動性收緊

資料來源:CEIC,香港金管局,中金公司研究部


More Content


