You are browsing the Hong Kong website, Regulated by Hong Kong SFC (CE number: BJA907). Investment is risky and you must be cautious when entering the market.
Q4單季度盈利10個億,恩捷股份泡沫消化完了嗎?

去年12月份以來,新能源行業個股整體下挫,寧德目前回調超過20%,鋰電池板塊指數已經回調了13%。

今日盤面,新能源相關個股依然萎靡不振,但是,擁有兩千億市值的恩捷股份卻走出獨立行情,一度衝高大漲8%,但隨着板塊的跳水,恩捷也一路走低,最終收漲3.01%。
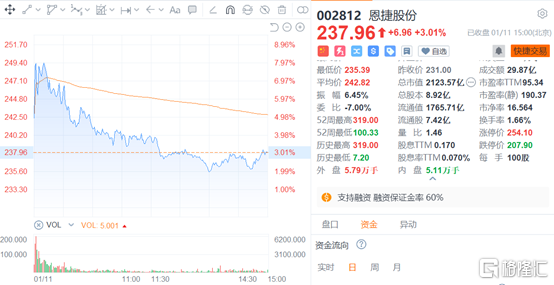
資料來源:富途

消息面上,恩捷股份發佈了業績預報,2021年全年實現淨利潤26.6-27.6億元,同比增長138.44%-147.4%,扣非淨利潤25.57-26.57億元,同比增長158.15%-168.25%,實現每股收益2.98-3.09元。
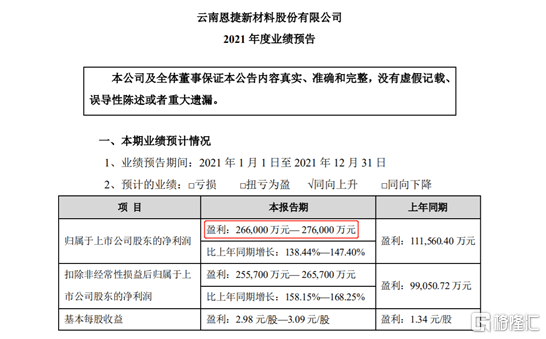
資料來源:同花順

2021年公司每期的業績幾乎都給投資者交出了滿意的答卷,Q4單季度預計盈利9.05-10.05億元,環比增長28.3%-42.5%,而2020年同期盈利4.7億元,同比也是增長近一倍。

不過,26.6-27.6億元的盈利也只是略高於機構預期。
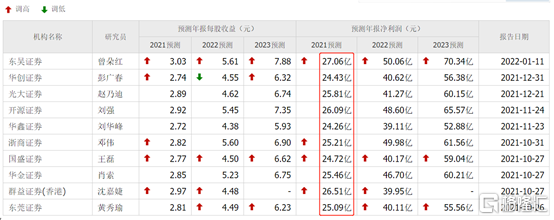
資料來源:同花順

確實近兩年來,市場給予新能源車產業鏈的預期已經打得夠滿了,各細分板塊未來5-10年的業績都已經反應在股價上,恩捷也不例外,兩年時間股價翻了七倍多,市盈率最高去到了150倍。
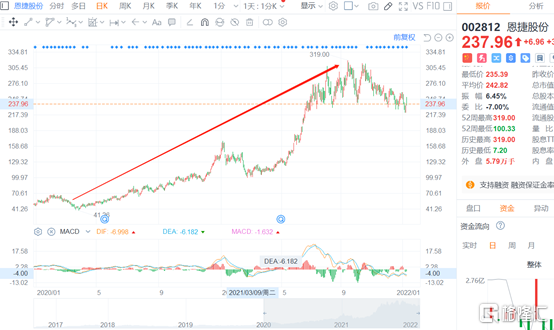
資料來源:富途

膈膜確實是個好生意,尤其是恩捷從2018年開始切入了鋰電濕法隔膜領域和消費濕法隔膜領域之後,盈利逐年大幅攀升。

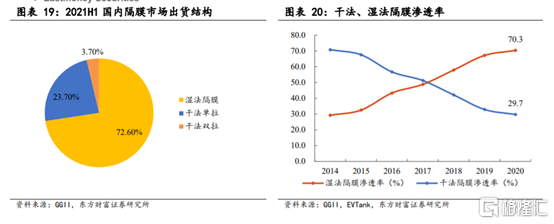
膈膜主要是用在新能源動力電池、儲能以及3C產品,目前三元和鐵鋰動力電池均採用濕法膈膜,國內磷酸鐵鋰儲能電池是用幹法隔膜,3C消費市場已經進入穩定增長階段,基本全部採用濕法隔膜。

由於濕法膈膜得到了塗覆技術的加持,性能方面比干法膈膜更勝一籌,濕法膈膜的滲透率逐年提升,截至2020年就已超過70%。

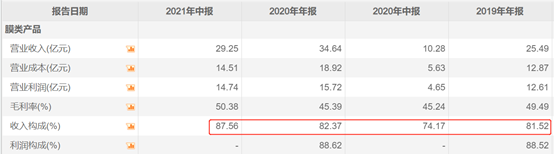
從公司業務結構來看,目前膜類產品收入佔比超過80%,膜類產品包括隔膜和BOPP薄膜,其中隔膜佔整體收入的比例在70%左右。

資料來源:choice

2020年國內鋰電隔膜總出貨量37.2億平方米,其中,幹法隔膜出貨量11億平方米,濕法隔膜出貨量26.2億平方米。

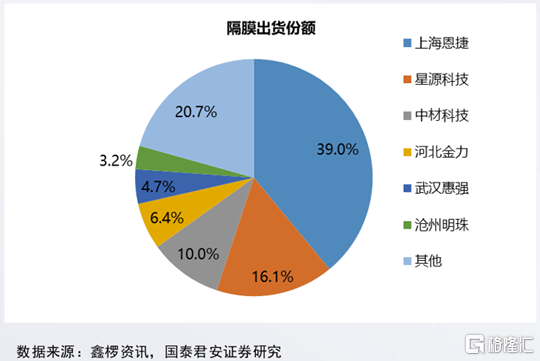
在行業地位方面,恩捷全年出貨量佔鋰電隔膜整體市場的31.5%,佔濕法隔膜市場的44.9%。

2021年,恩捷的膈膜出貨份額已經達到了39%。

儲能方面,公司也在建幹法隔膜產能,並收購了東航光電,為儲能電池做準備。

雖然公司已在濕法膈膜深耕多年,但行業競爭非常激烈,同行公司如星源材質、中材科技也在加速佈局濕法隔膜領域。

未來最大的兩個競爭要素,一是基膜成本,二是塗覆技術。

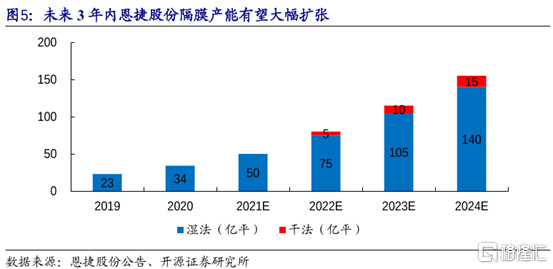
在膈膜爆發的初期,恩捷一直是以低價策略搶佔市場份額,從而鞏固了龍頭地位,同時進行大幅擴產能。

這兩年面對強勁的市場需求,恩捷產能規模已位居全球首位,大幅領先於行業,規模優勢給公司帶來了巨大的效益。

同時公司在積極佈局塗覆技術,取得LG化學、日本帝人塗覆專利授權。

從成本到產能、再到技術,恩捷似乎一直走在行業的前沿。

恩捷股份作為鋰電池膈膜龍頭,自去年9月份以來,股價也回落超過了20%,但目前市盈率仍高達92倍,估值仍處於歷史較高水平,這也是近期回調的最大原因。
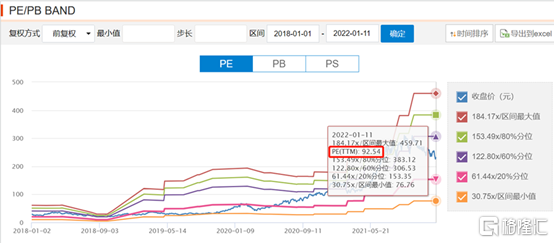
資料來源:choice

目前恩捷並沒有特別合適做估值對照的公司,介於公司正處於高成長階段,可以採用PEG來估值。

市場預測,2021年公司隔膜出貨量大約是30億平,2022年出貨量預計將達到45-50億平,2023年65-70億平。
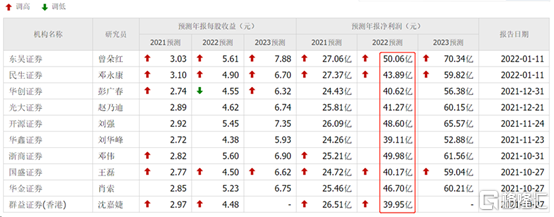
資料來源:同花順

對應2021-2023年公司淨利潤分別為27億元、45億元、60億元,年複合增速約50%,目前公司PE在90倍左右,PEG遠大於1,説明當前股價仍處於高估。

公司目前的規模和技術優勢還處於紅利期,未來2年的效益還是具備確定性的,只是估值仍有泡沫。

Follow us
Find us on Facebook, Twitter , Instagram, and YouTube or frequent updates on all things investing.Have a financial topic you would like to discuss? Head over to the uSMART Community to share your thoughts and insights about the market! Click the picture below to download and explore uSMART app!
Disclaimers
uSmart Securities Limited (“uSmart”) is based on its internal research and public third party information in preparation of this article. Although uSmart uses its best endeavours to ensure the content of this article is accurate, uSmart does not guarantee the accuracy, timeliness or completeness of the information of this article and is not responsible for any views/opinions/comments in this article. Opinions, forecasts and estimations reflect uSmart’s assessment as of the date of this article and are subject to change. uSmart has no obligation to notify you or anyone of any such changes. You must make independent analysis and judgment on any matters involved in this article. uSmart and any directors, officers, employees or agents of uSmart will not be liable for any loss or damage suffered by any person in reliance on any representation or omission in the content of this article. The content of the article is for reference only and does not constitute any offer, solicitation, recommendation, opinion or guarantee of any securities, virtual assets, financial products or instruments. Regulatory authorities may restrict the trading of virtual asset-related ETFs to only investors who meet specified requirements. Any calculations or images in the article are for illustrative purposes only.
Investment involves risks and the value and income from securities may rise or fall. Past performance is not indicative of future performance. Please carefully consider your personal risk tolerance, and consult independent professional advice if necessary.
uSMART
Wealth Growth Made Easy
Open Account