港股收評:恆指重挫3.64%,失守29000點,科技股全線暴跌!
2月26日,港股三大指數集體大跌,行業板塊近乎全線下挫,市場情緒降至冰點。截至收盤,恆指跌3.64%重挫1100點失守29000大關,恆生科技指數跌5.71%報8954點,國企指數收跌3.89%。本週內,國企指數累跌7.1%;恆指累跌5.43%,爲去年3月以來最大周跌幅;恆生科技指數累跌15.21%。2月行情收官恆指漲2.46%,國指漲0.34%,恆生科技指數跌4.31%。
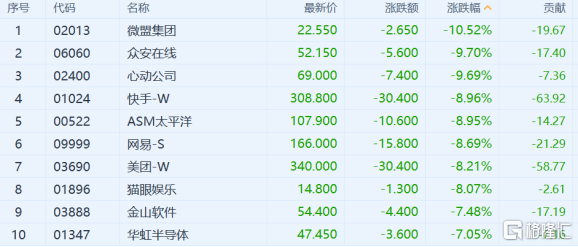
盤面上,有色金屬股大跌居前,特斯拉概念股、手遊股、軍工股、汽車股、半導體、航空股、紙業股、石油股等集體大跌,科技股再度遭受重創,美團、網易暴跌超8%,騰訊、阿里巴巴跌超4%,所有活躍股均表現低迷,惟農業股小幅上揚。
近日港股命途多舛,前日因港府計劃加股票印花稅導致大跌,昨日市場稍有起色,今日因外圍暴跌再度跟隨市場下挫,前期報團股陸續遭到血洗,市場明顯無新熱點接力。南下資金淨流入30.94億港元,大市成交額再上3200億港元。
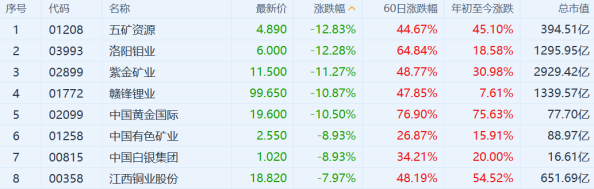
具體行業板塊方面,有色金屬領跌大市。板塊中五礦資源、洛陽鉬業跌超12%;紫金礦業跌逾11%;贛鋒鋰業、中國黃金國際跌逾10%。
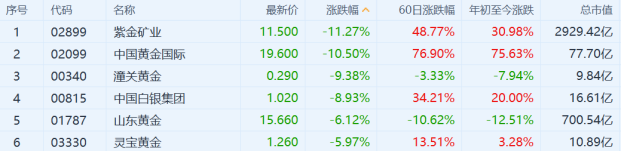
黃金及貴金屬板塊跌幅靠前,午後跌勢加大。潼關黃金跌近9.5%;中國白銀集團跌近9%。
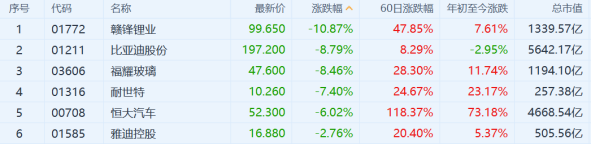
受隔夜美股市場上特斯拉暴跌影響,港股特斯拉概念股受挫。贛鋒鋰業跌超10%;比亞迪股份、福耀玻璃跌超8%;恆大汽車跌逾6%。
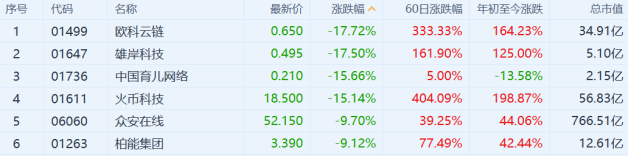
比特幣再度回調,失守4.6萬美元大關,區塊鏈概念股集體暴跌。歐科雲鏈大跌近18%,雄岸科技跌17.5%,火幣科技跌超15%。
恆生科技指數今日大跌5.71%,成分股全線暴跌。快手跌近9%;美團、網易暴跌超8%,騰訊、阿里巴巴跌超4%。
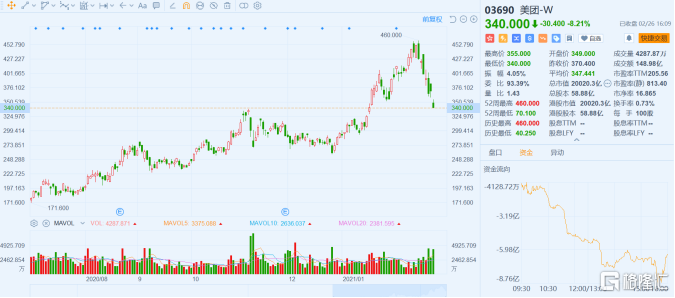
個股方面,美團今日大跌8.21%,領跌恆指。本週前四個交易日,美團遭南向資金累計淨賣出近67億港元。本週累計已跌去19%,最新股價報340港元,總市值回到2萬億港元。
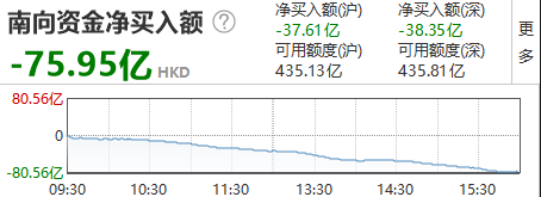
港股通方面,今日南向資金合計淨流出75.95億港元,其中港股通(滬)淨流出37.61億港元,港股通(深)淨流出38.35億港元。
華盛證券表示,美股昨晚再次出現小型股災,各指數跌幅由不足2%至超過3.5%,更齊跌至近低位收市。未見往日的反彈。相信主要原因是債券市場上息率再創年內新高。10年期息率竟高至1.614釐。而5年期息率也跟上0.865釐的高位。同時間,在芝加哥期貨市場內的波動率指數 VIX跟隨衝上31.16的高位,反映出投資者的恐慌。因此沒有反彈的情況出現。如果債券息率再持續上升,股票市場要繼續尋底。
Follow us
Find us on
Facebook,
Twitter ,
Instagram, and
YouTube or frequent updates on all things investing.Have a financial topic you would like to discuss? Head over to the
uSMART Community to share your thoughts and insights about the market! Click the picture below to download and explore uSMART app!

Disclaimers
uSmart Securities Limited (“uSmart”) is based on its internal research and public third party information in preparation of this article. Although uSmart uses its best endeavours to ensure the content of this article is accurate, uSmart does not guarantee the accuracy, timeliness or completeness of the information of this article and is not responsible for any views/opinions/comments in this article. Opinions, forecasts and estimations reflect uSmart’s assessment as of the date of this article and are subject to change. uSmart has no obligation to notify you or anyone of any such changes. You must make independent analysis and judgment on any matters involved in this article. uSmart and any directors, officers, employees or agents of uSmart will not be liable for any loss or damage suffered by any person in reliance on any representation or omission in the content of this article. The content of the article is for reference only and does not constitute any offer, solicitation, recommendation, opinion or guarantee of any securities, virtual assets, financial products or instruments. Regulatory authorities may restrict the trading of virtual asset-related ETFs to only investors who meet specified requirements. Any calculations or images in the article are for illustrative purposes only.
Investment involves risks and the value and income from securities may rise or fall. Past performance is not indicative of future performance. Please carefully consider your personal risk tolerance, and consult independent professional advice if necessary.


