3月暴跌40%!高鑫零售究竟發生了什麼?
港股高鑫零售今日低開低走,截至發稿跌超11%,現價7.7港元創近一年內新低。暫成交近4.6億港元,最新總市值734.56億港元。
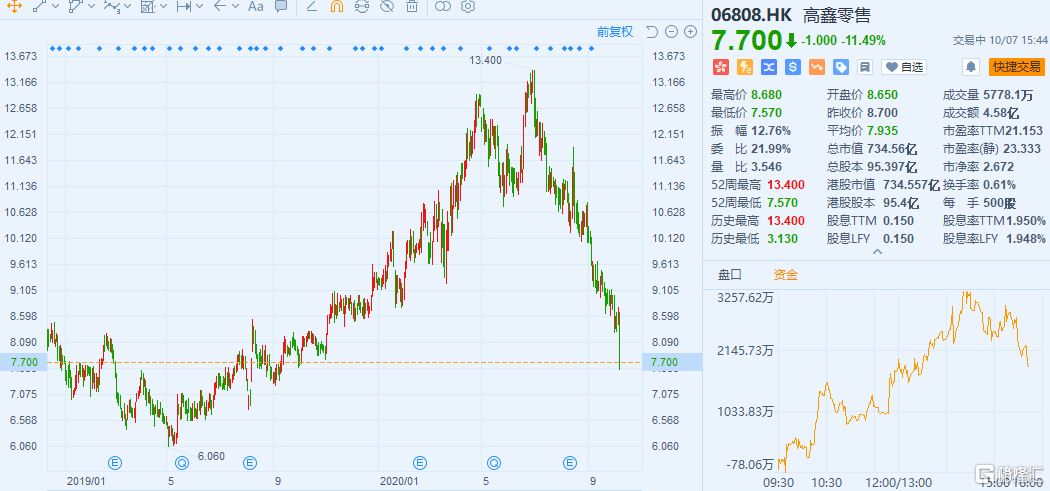
數據來源:富途牛牛
自7月份開始,高鑫零售便陰跌不止。8月中旬公佈中期業績後,公司股價表現並未改善,至今已累計跌近42%。
考慮到從19年5月至今年6月底的大概一年時間內,高鑫零售股價累計大漲了一倍有餘,創下歷史最高價13.4港元。本輪40%的下跌,可以視為市場正常的調整回落。
消息面上,瑞銀髮表報告下調高鑫零售投資評級,由原來“買入”降至“中性”,將目標價由15.62港元大幅下降42%至9.07港元,並將其剔出該行亞太區焦點股份名單。
瑞銀認為,內地消費行為正在改變,轉以社區為本的“新零售”令線下交易減幅超預期,預測高鑫零售的同店銷售將收縮13-14%。並且由於租金收入下降和新投資,導致高鑫零售盈利能力下降,因此將高鑫零售2020-2022年盈利預測下調9-40%。
但在具體財務業績方面,上半年高鑫零售的表現實際是優於行業數據的。半年報顯示,期內公司營收總額為532億元(人民幣,下同),同比增長5%。淨利潤20.62億元,同比增長17%,高於市場預期3%。
銷售增長的主要原因,來自於大股東阿里巴巴的賦能。阿里巴巴2017年11月斥資224億港元入股高鑫零售,目前是其第二大股東,持有21%股權。阿里巴巴財報顯示,截至2020年3月31日止的12個月裏,以淘鮮達為主的阿里巴巴商業平台,為高鑫零售帶來的收入約佔其總收入的10%。
通過淘鮮達及天貓平台,高鑫零售線上B2C業務實現大幅成長,盈利能力也有所提升。上半年公司B2C業務一季度實現店日均單量750+單,二季度為950+單。截至報告期末,B2C用户數接近5000萬,活躍用户數接近1300萬;而B2B業務分別為60萬和25萬。
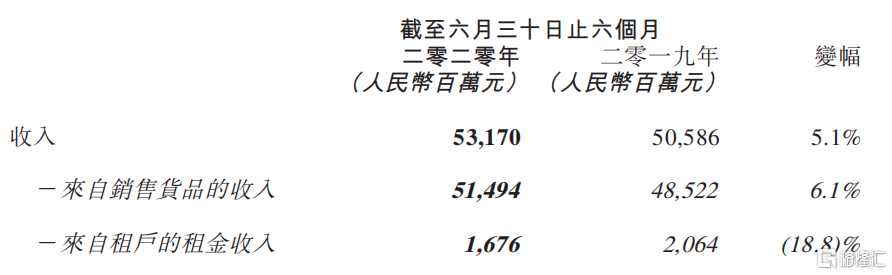
數據來源:港交所公告
另據高鑫零售公告顯示,上半年公司租金收入16.76億元,同比降低18.8%。主要原因是受新冠疫情影響,公司給予部分租户租金減免。同樣在疫情影響下,上半年高鑫零售展店速度較慢,新增一家中型超市,關閉了三家虧損門店。
在未來預期方面,隨着疫情好轉, 高鑫零售在下半年拓店規劃上預計新開大賣場11家,中型超市2~3家,盒馬超市4家,小超市30~50家。
對於明年的開店目標指引,管理層預計中超新增開30~50家,小超增加200家以上。在拓店上將重新回到快速開店的軌道,並將未來展店的主力放在中型超市和小超市上。
不同於瑞銀的觀點,花旗發表研究報告表示看好高鑫零售與阿里巴巴的合作,雙方合作將進一步拓展至在數字經濟領域,相信市場會在高鑫同店銷售穩定時,對第四季及2021年時的競爭形勢更為欣賞。該行對高鑫零售維持目標價14.42港元及買入評級。
Follow us
Find us on
Facebook,
Twitter ,
Instagram, and
YouTube or frequent updates on all things investing.Have a financial topic you would like to discuss? Head over to the
uSMART Community to share your thoughts and insights about the market! Click the picture below to download and explore uSMART app!

Disclaimers
uSmart Securities Limited (“uSmart”) is based on its internal research and public third party information in preparation of this article. Although uSmart uses its best endeavours to ensure the content of this article is accurate, uSmart does not guarantee the accuracy, timeliness or completeness of the information of this article and is not responsible for any views/opinions/comments in this article. Opinions, forecasts and estimations reflect uSmart’s assessment as of the date of this article and are subject to change. uSmart has no obligation to notify you or anyone of any such changes. You must make independent analysis and judgment on any matters involved in this article. uSmart and any directors, officers, employees or agents of uSmart will not be liable for any loss or damage suffered by any person in reliance on any representation or omission in the content of this article. The content of the article is for reference only and does not constitute any offer, solicitation, recommendation, opinion or guarantee of any securities, virtual assets, financial products or instruments. Regulatory authorities may restrict the trading of virtual asset-related ETFs to only investors who meet specified requirements. Any calculations or images in the article are for illustrative purposes only.
Investment involves risks and the value and income from securities may rise or fall. Past performance is not indicative of future performance. Please carefully consider your personal risk tolerance, and consult independent professional advice if necessary.


