李寧(2331.HK)年報詳解:再創佳績,盈利提升超預期,給予“強 烈推薦”評級
機構:方正證券
評級:強烈推薦
【事件】 2020 年 3 月 27 日,公司發佈業績報告,2019 年實現營收、歸 母淨利潤達 138.70、14.99 億元,同比增長 31.9%、109.6%,扣 除一次性與經營無關損益的歸母淨利潤達 12.66 億元,同比增 長 77%,超市場預期。
【點評】 業績維持高增長。2019 年受益公司門店加速擴張、渠道轉型、 線下同店持續提升,營收同比增長達 32%。因毛利率提升、費 用率下降、一次性受益較高,歸母淨利潤增長迅速。 同店增長迅速,渠道結構優化。渠道經營方面,2019 全年流水 (含線上、不含童裝)同比增 28%(2018 年增 15%),線下流 水增 26%(2018 年增 11%),同店增速不到 20%,線上收入提 升超過 40%。渠道數量方面,2019 年公司總門店增速達 5.8%, 其中李寧品牌直營門店、經銷門店、李寧 young 增速分別為 -16.4%、6.6%、38.3%,直營門店下滑主因公司直營轉加盟,李 寧 young 及中國李寧門店增長迅速。品類方面,跑步、訓練、 籃球、運動時尚流水分別下降 1%、提升 15%、提升 45%、提升 52%。核心品類運動時尚(32%)及籃球(28%)佔比進一步提升 至 60%(去年僅 50%)。 疫情影響方面,公司 1 季度流水預計下滑超 20%,相比其他內 資龍頭品牌影響相對較小,此外因公司單品牌、多品類、多渠 道,海外業務有限,全球疫情擴散對公司的業績表現影響有限。
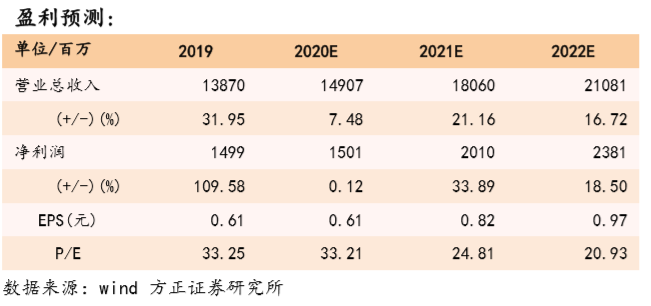
【投資建議】 預計 2020、 2021、2022 年公司歸母淨利潤分別為 15.01、20.10、 23.81 億元,同比增速達 0.12%、33.89%、18.50%,對應 EPS 為 0.61、0.82、0.97 元/股,對應 P/E 為 33、25、21,給予“強 烈推薦”評級。
【風險提示】 (1)經濟下滑超預期;(2)全球疫情控制不及預期;(3)童 裝及中國李寧營業收入增長不及預期的風險。
Follow us
Find us on
Facebook,
Twitter ,
Instagram, and
YouTube or frequent updates on all things investing.Have a financial topic you would like to discuss? Head over to the
uSMART Community to share your thoughts and insights about the market! Click the picture below to download and explore uSMART app!

Disclaimers
uSmart Securities Limited (“uSmart”) is based on its internal research and public third party information in preparation of this article. Although uSmart uses its best endeavours to ensure the content of this article is accurate, uSmart does not guarantee the accuracy, timeliness or completeness of the information of this article and is not responsible for any views/opinions/comments in this article. Opinions, forecasts and estimations reflect uSmart’s assessment as of the date of this article and are subject to change. uSmart has no obligation to notify you or anyone of any such changes. You must make independent analysis and judgment on any matters involved in this article. uSmart and any directors, officers, employees or agents of uSmart will not be liable for any loss or damage suffered by any person in reliance on any representation or omission in the content of this article. The content of the article is for reference only and does not constitute any offer, solicitation, recommendation, opinion or guarantee of any securities, virtual assets, financial products or instruments. Regulatory authorities may restrict the trading of virtual asset-related ETFs to only investors who meet specified requirements. Any calculations or images in the article are for illustrative purposes only.
Investment involves risks and the value and income from securities may rise or fall. Past performance is not indicative of future performance. Please carefully consider your personal risk tolerance, and consult independent professional advice if necessary.


