You are browsing the Hong Kong website, Regulated by Hong Kong SFC (CE number: BJA907). Investment is risky and you must be cautious when entering the market.
安踏体育半年赚25亿FILA是最成功的收购?
格隆汇 08-27 10:25

一、事件

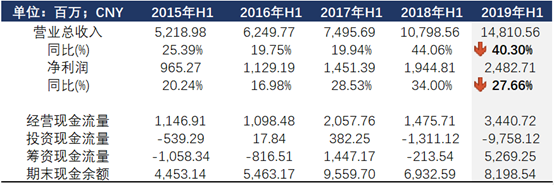
安踏体育(2020.HK)公布,营收额148.1亿元人民币,较去年同期的105.53亿元增长40.3%;股东应占溢利25亿元,同比增长27.7%;

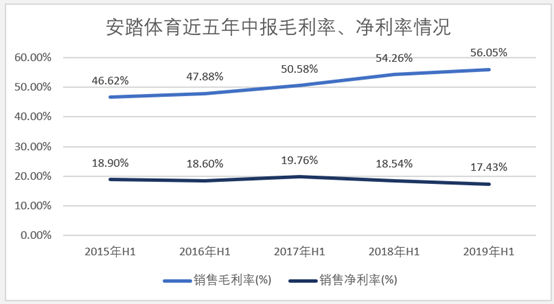
毛利83.02亿元,较去年同期的57.26亿元增长45%,毛利率上升1.8个百分点至56.1%;每股基本盈利同比增长27.7%至0.925元,股息占股东应占溢利的30.5%。

二、点评

安踏体育屡次遭到杀人鲸资本、浑水、GMT Research Limited等沽空机构的狙击,被攻击的重心常围绕 FILA。这次中报,安踏体育也首次披露FILA的核心数据。

整体看,从2015年起,安踏体育已经连续5年保持营收、净利实现双位数增长,但今年的半年报两者增速都有所放缓。去年上半年,安踏体育总营收和净利润分别同比增长44.06%和34%,2019H1同期为40.3%和27.7%,略显疲态。

但对比国内体育用品同行,安踏体育的营收增速依然位居第一。和这次业绩劲爆的李宁(2331.HK)相比,营收规模和增速一骑绝尘。

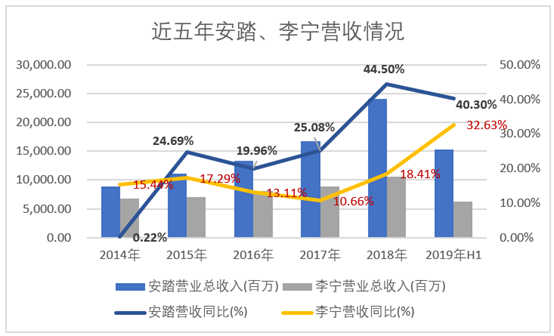
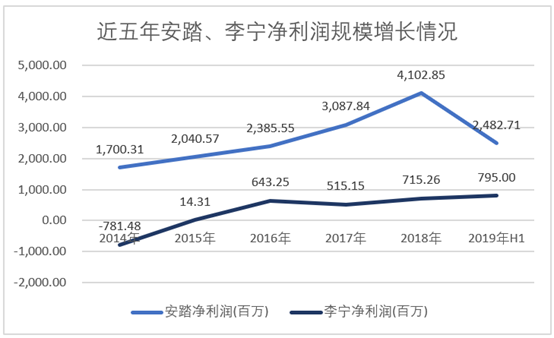
 安踏的净利润近25亿,李宁近8亿,相差三倍有余。增速方面,底部回升的李宁显得更强劲。李宁的净利润增速达到196%,安踏近28%

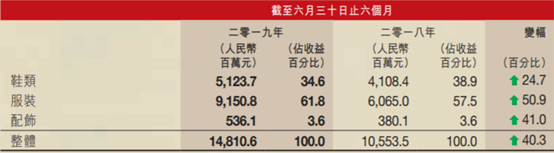
从品类上看,上半年安踏体育鞋类营收51.24亿元,占总营收34.6%,同比增长24.7%;服装收入为91.51亿,占总营收61.8%,同比增长50.9%;配饰类收入同比增长41%至5.36亿元。服装和配饰类同比增长较快。

FILA贡献了44.1%的整体收益,ANTA牌的贡献比达到51.2%,FILA差不多能和主品牌平分秋色。FILA和ANTA牌营业利润分别录得24.423亿元和18.944亿元,较2018年的17.189亿元和10.470亿元分别增长42.1%及80.9%。

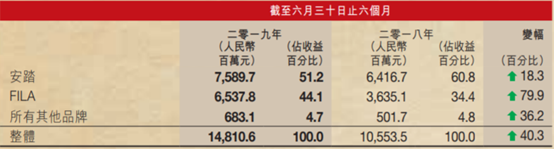
整体毛利率同比升1.8%至56.05%,主要由于FILA分部的贡献增加。ANTA牌的毛利率同比减少1.6%至42.5%,FILA的毛利率为71.5%。

2009年安踏收购FILA,当时付出的代价为3.25亿。如今,FILA半年贡献的经营利润就达到18.9亿元。

收购FILA是安踏体育最成功的战略之一,FILA目前处于渠道扩张期,短期是公司最重要的增长动力,直营模式能够助力业绩增长。

DESCENTE、KOLON SPORT等处于建设期,有望带动公司收入和利润率继续提升。至于,收购的Amer完善公司矩阵,未来业绩提升可期。

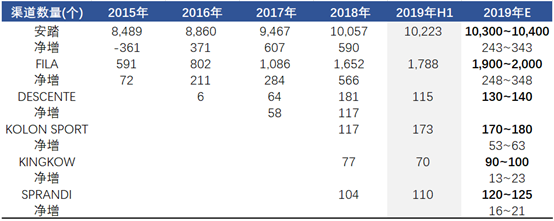
对比渠道,上半年,中国大陆安踏店 (包括安踏儿童独立店)达到10,223家。中国大陆、香港、澳门及新加 坡FILA 店(包括FILA KIDS 、FILA FUSION独立店)总数达到1,788家。而李宁共有门店7,294家,其中,直营门店降8.4%至1379家。两者门店规模差距较大。

安踏体育借助国际并购快速形成新品牌,目前分有大众品牌、时尚、专业运动三大品牌群。而竞争对手李宁虽然也有进行收购,但一直都将重心放在主品牌上,围绕创始人的IP进行开发,强化旗下各产品线。

从纽约时装周、巴黎时装周,以及成立的新品牌“中国李宁”都可以看出,李宁的运动时尚化策略非常清晰。在强调国货的同时,进行了更时尚化的创新,相对于安踏,它的运动时尚风走得更加特立独行。目前,李宁也还处于高增长期,时尚国货的赛道也刚刚开始。

安踏体育通过十年的耕耘,如今已经发展成为国内运动服饰领头羊。在品牌运营方面十具优势。迎合了消费趋势,双方都获得靓丽的业绩增长,未来竞争也会愈发激烈。

在中国市场,这两大品牌还要面对诸如NIKE、ADIDAS等国际大牌。消费者日益追求功能性,产品技术才是品牌的护城河,只有提升产品的专业性,才有望赶超国际大牌。

股价方面,目前股价已经反映利好,投资需谨慎。

Follow us
Find us on Facebook, Twitter , Instagram, and YouTube or frequent updates on all things investing.Have a financial topic you would like to discuss? Head over to the uSMART Community to share your thoughts and insights about the market! Click the picture below to download and explore uSMART app!
Disclaimers
uSmart Securities Limited (“uSmart”) is based on its internal research and public third party information in preparation of this article. Although uSmart uses its best endeavours to ensure the content of this article is accurate, uSmart does not guarantee the accuracy, timeliness or completeness of the information of this article and is not responsible for any views/opinions/comments in this article. Opinions, forecasts and estimations reflect uSmart’s assessment as of the date of this article and are subject to change. uSmart has no obligation to notify you or anyone of any such changes. You must make independent analysis and judgment on any matters involved in this article. uSmart and any directors, officers, employees or agents of uSmart will not be liable for any loss or damage suffered by any person in reliance on any representation or omission in the content of this article. The content of the article is for reference only and does not constitute any offer, solicitation, recommendation, opinion or guarantee of any securities, virtual assets, financial products or instruments. Regulatory authorities may restrict the trading of virtual asset-related ETFs to only investors who meet specified requirements. Any calculations or images in the article are for illustrative purposes only.
Investment involves risks and the value and income from securities may rise or fall. Past performance is not indicative of future performance. Please carefully consider your personal risk tolerance, and consult independent professional advice if necessary.
uSMART
Wealth Growth Made Easy
Open Account